If you have spent any time reading buyer guides on how to purchase an RV park, you have probably noticed a pattern. RV park operations gets one section, usually near the bottom, tucked in after cap rates, financing structures, and infrastructure diligence. It reads like a warning label. Watch out for deferred maintenance. Watch out for utility capacity. Watch out for seasonal cash flow. Then the guide moves on to the next deal.
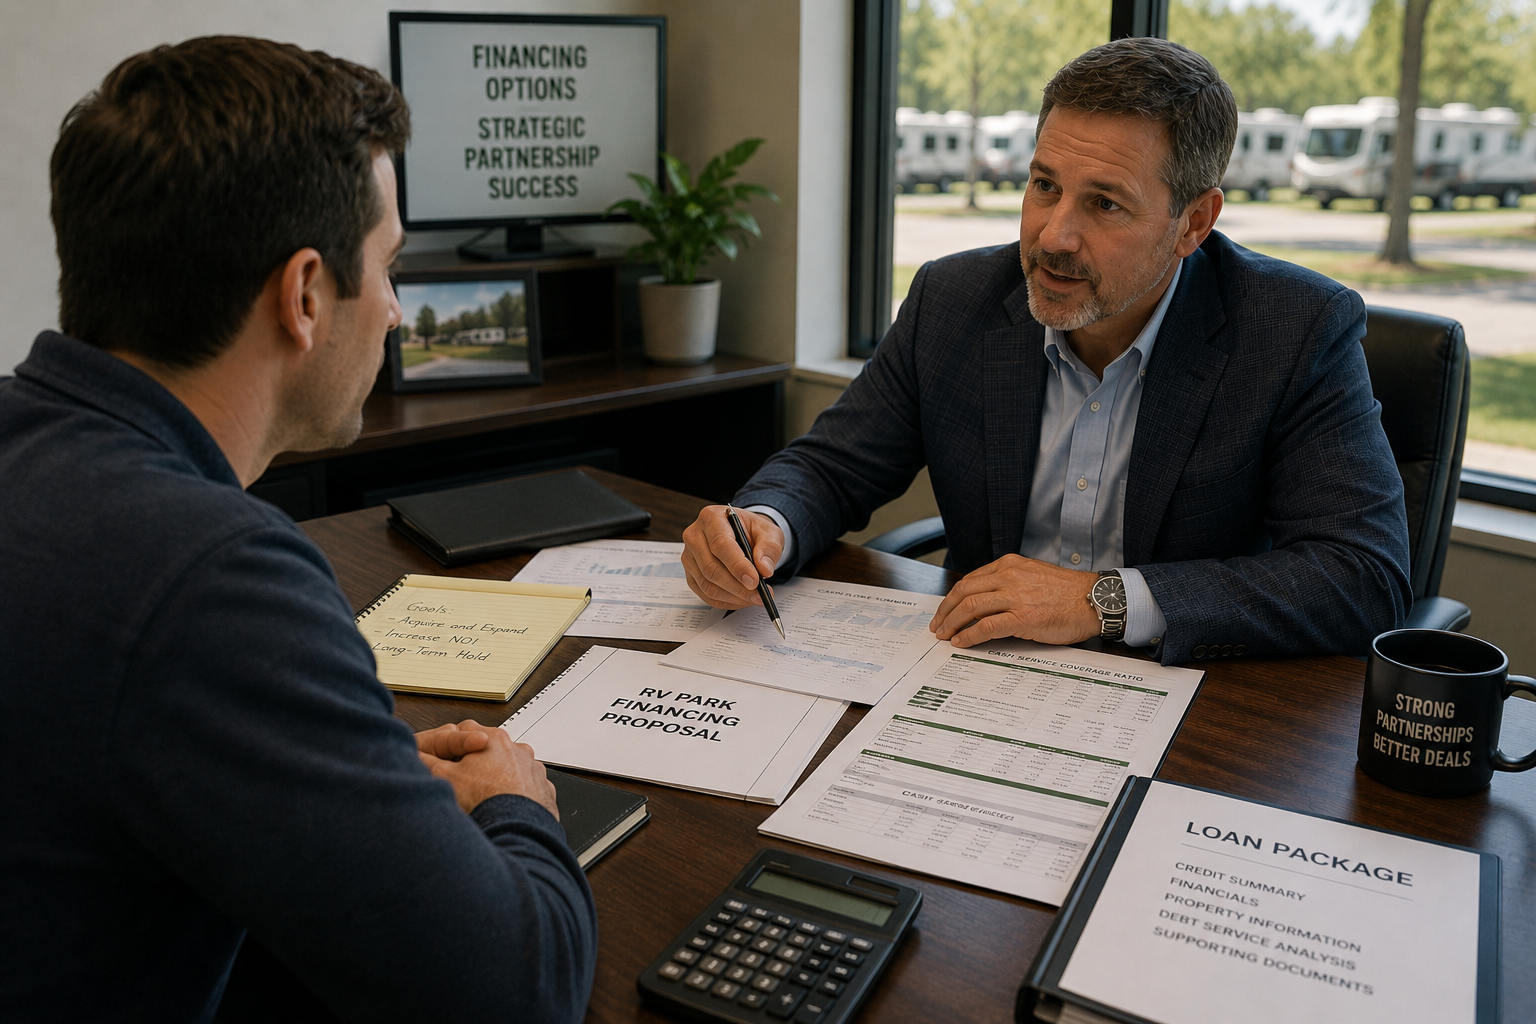
I get why that happens. Most of the content out there is written by people whose job ends at closing. Brokers, acquisition consultants, and deal sourcing shops are paid to get you to the closing table, not to run the business afterward. So RV park operations shows up as a risk to price around, not as the actual work you are about to take on for the next five, ten, or twenty years. I have written before about the financial side of this gap in my Acquiring an RV Park posts, but the operating side deserves just as much attention.
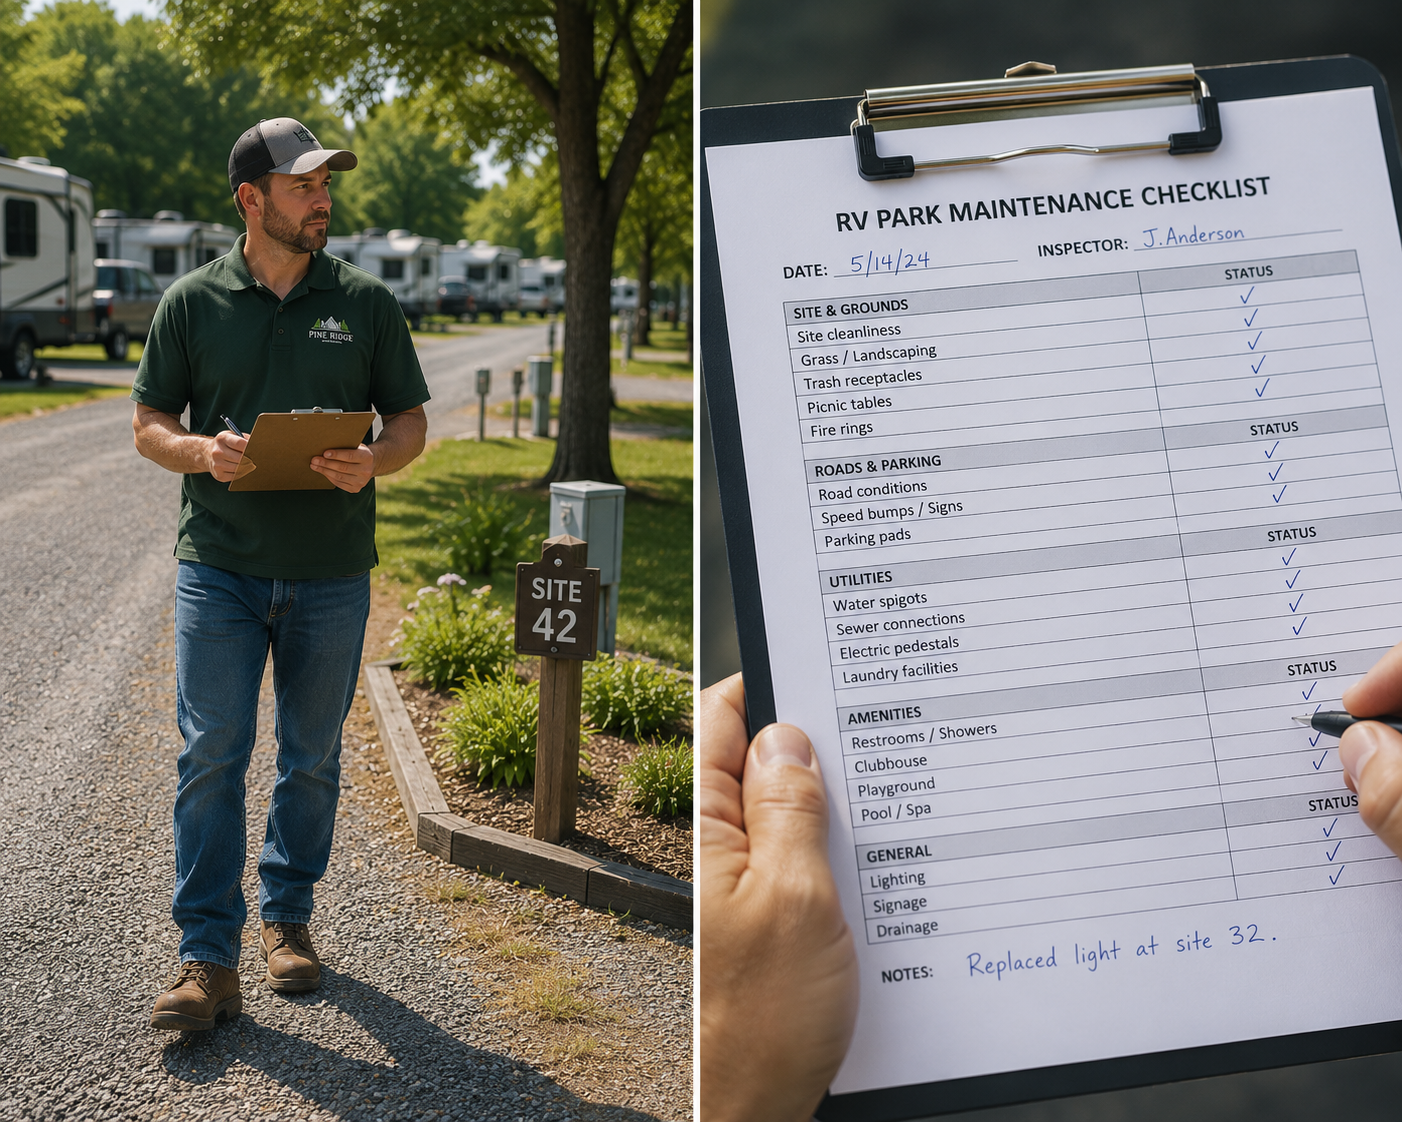
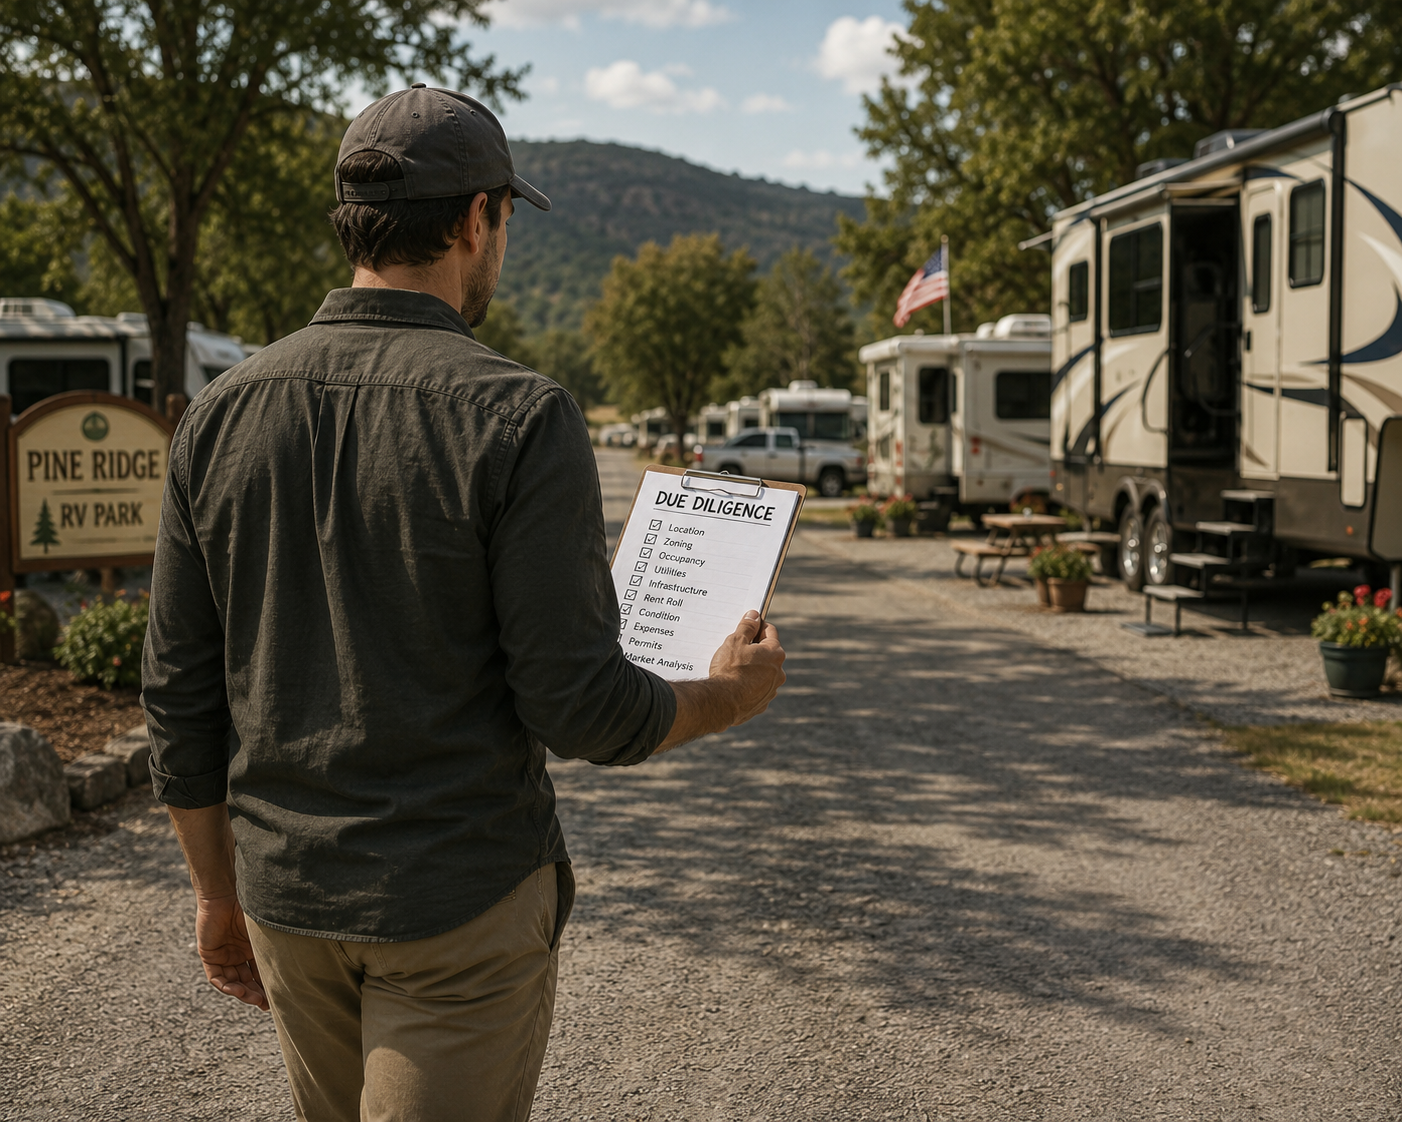
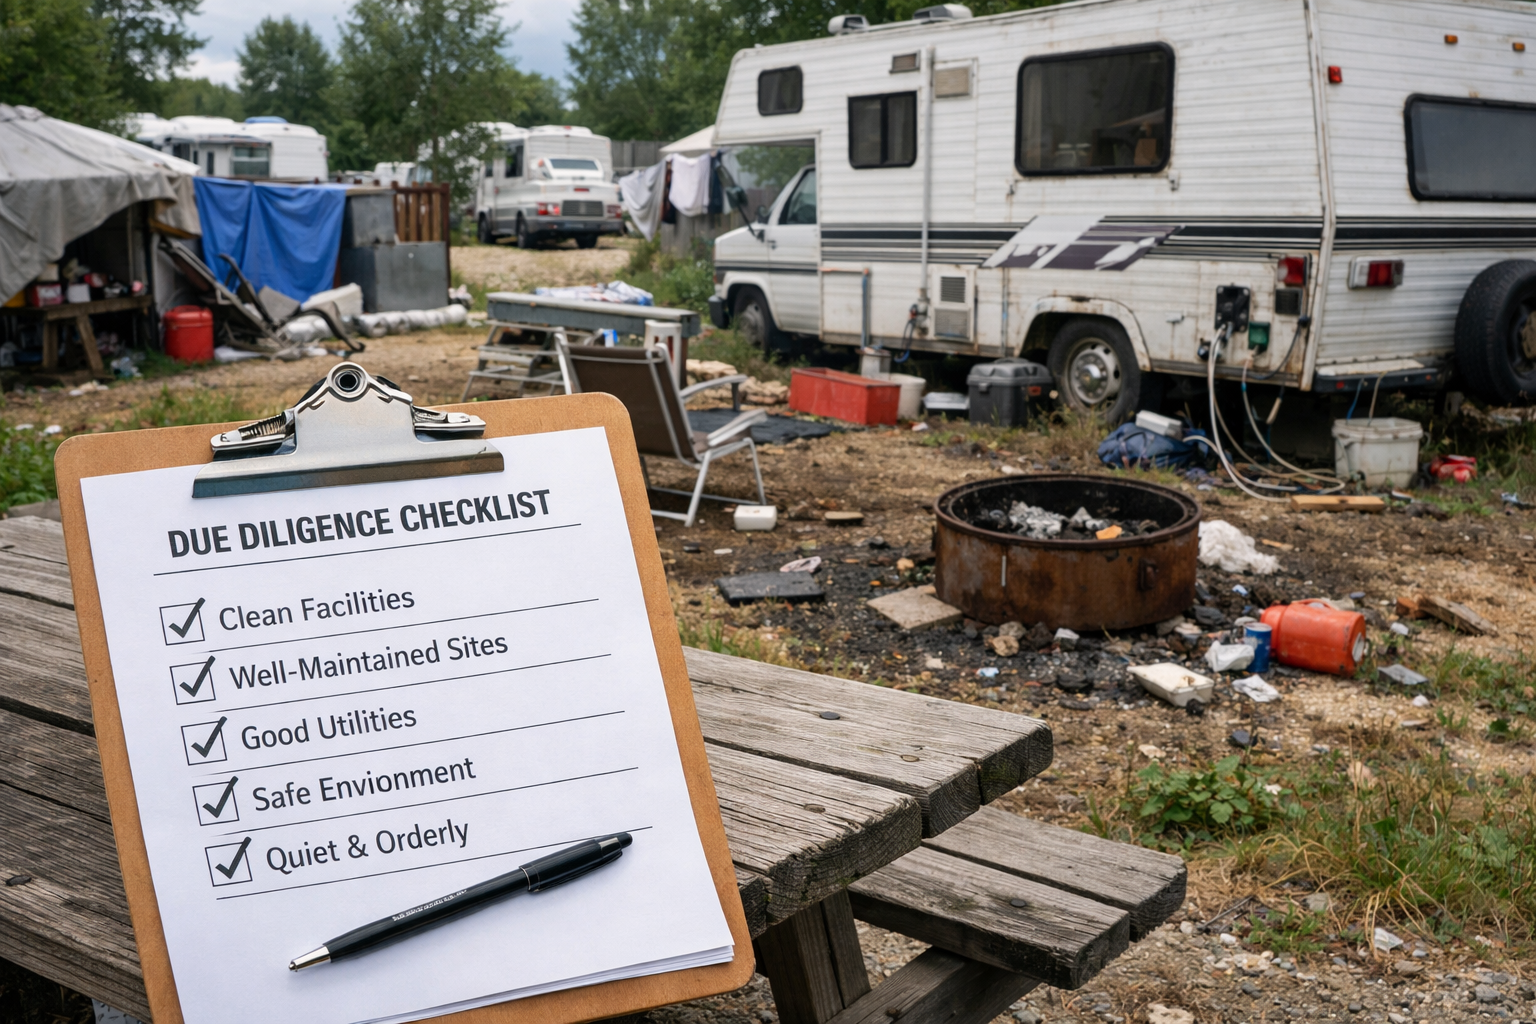
Here is the problem with that framing. RV park operations is not a line item you check off during due diligence. It is the entire business. The checklist mentality tells new owners that once they have confirmed the septic system is adequate and the occupancy trend looks stable, the hard part is behind them. In reality, that is the moment the real work starts.
Why the Checklist Framing Sets Owners Up to Struggle
When RV park operations only shows up as a diligence category, new owners walk into closing thinking they have already done the operational thinking. They have not. They have confirmed the property is not obviously broken. That is a very different thing from knowing how to run RV park operations well day to day.
I have talked to owners who did everything right on paper. They hired a good closing attorney, they got a clean environmental report, they verified the T-12 income statement, and the deal looked solid from every angle a checklist could measure.
Then six months in, they were blindsided by things no checklist ever mentions. Guests testing every rule because nobody enforced them consistently, which I dug into in detail in my post on RV park rule enforcement. A manager who could observe problems but had no real authority to fix them. A seasonal cash flow crunch that the pro forma technically accounted for but that nobody prepared them to actually live through, something I cover more in my Cash Flow Management posts. RV park operations problems do not show up in a due diligence binder. They show up in the day to day.
Some of the bigger names writing acquisition content lean even further in the wrong direction, treating RV park operations as a pure cost cutting exercise once you own the property, squeeze margins, cut amenities, and call it efficiency. That approach might move a spreadsheet in the short term, but it is a fast way to tank your reviews, your occupancy, and your guest retention. Real RV park operations is not about cutting until something breaks. It is about running a business that guests want to return to while still hitting your numbers, which is a big part of why I built my Fractional CFO Services around ongoing operating support, not just a one-time acquisition review.
What RV Park Operations Actually Looks Like Once You Own the Park
It is a daily rhythm, not a one-time review. Due diligence happens once. RV park operations happens every day you own the property, through every season, every staff turnover, every guest complaint, and every slow month that tests your cash reserves.
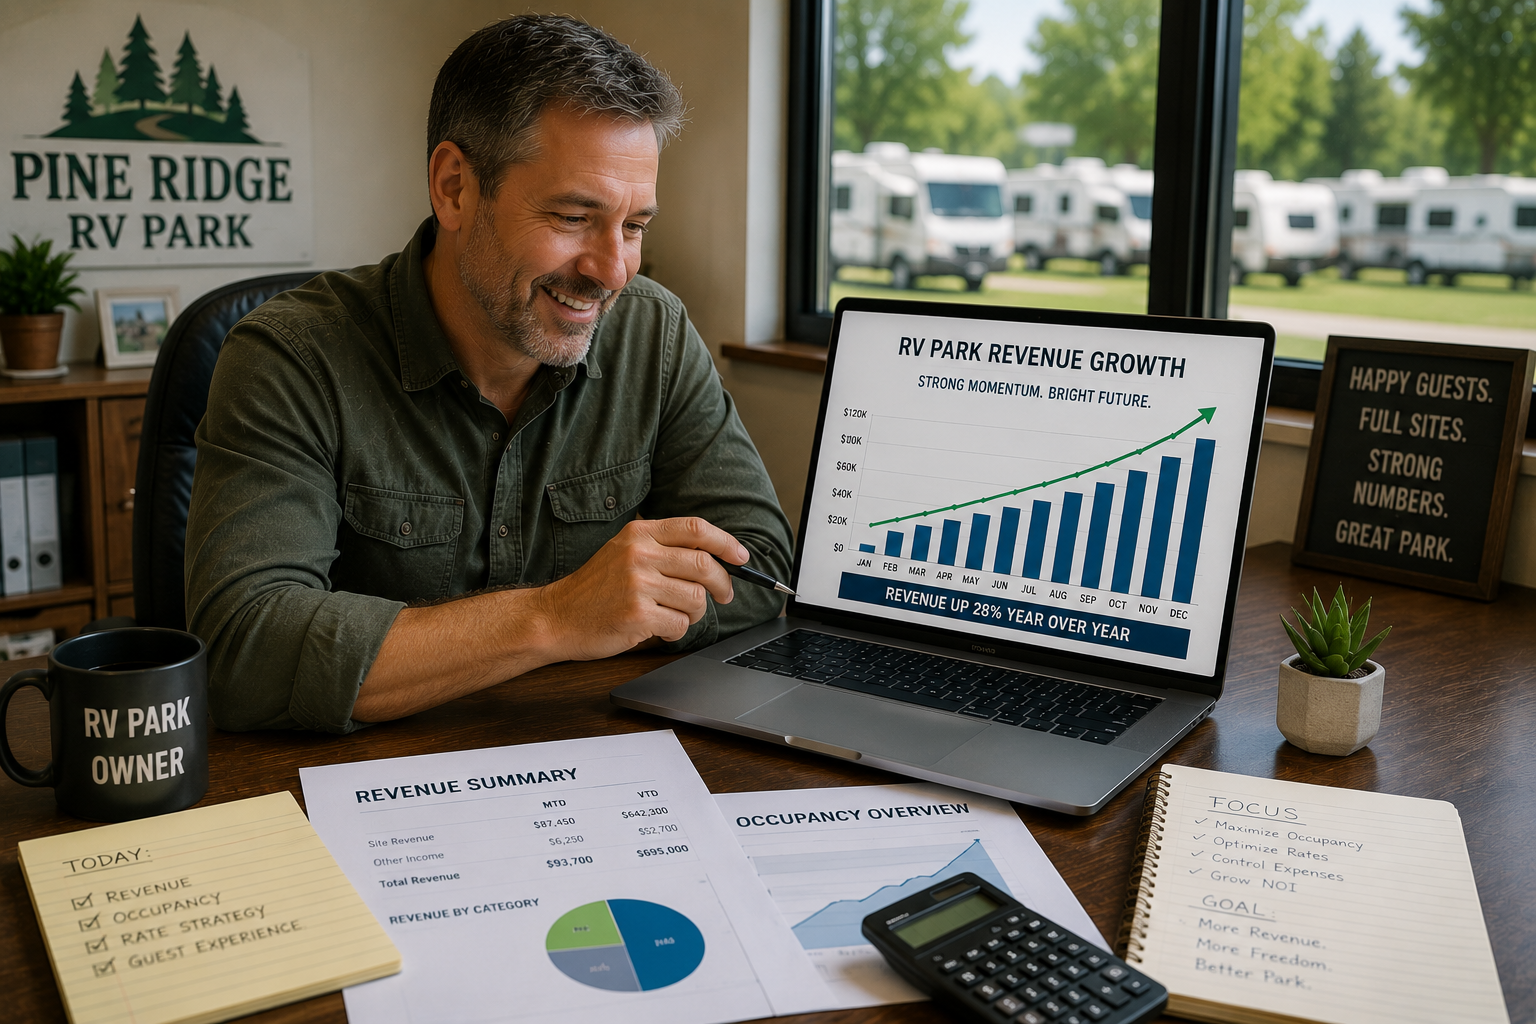
It requires real decisions, not just verified numbers. Diligence confirms the T-12 is accurate. RV park operations is deciding what to do when a slow shoulder season shows up exactly as the numbers predicted and you still have payroll and debt service due. Knowing the number ahead of time does not make living through it easy.
It means enforcing your own standards, not just setting them. A rules page in your welcome packet is a diligence item. Actually enforcing quiet hours, leash rules, and site upkeep standards every single week is RV park operations. This is the piece most acquisition guides skip entirely, because it cannot be reduced to a checkbox.
It means managing people, not just verifying a staffing plan. Diligence asks whether the current manager will stay on. RV park operations asks whether that manager has the training, authority, and support to actually run the property the way you need it run, and what you do if the answer is no.
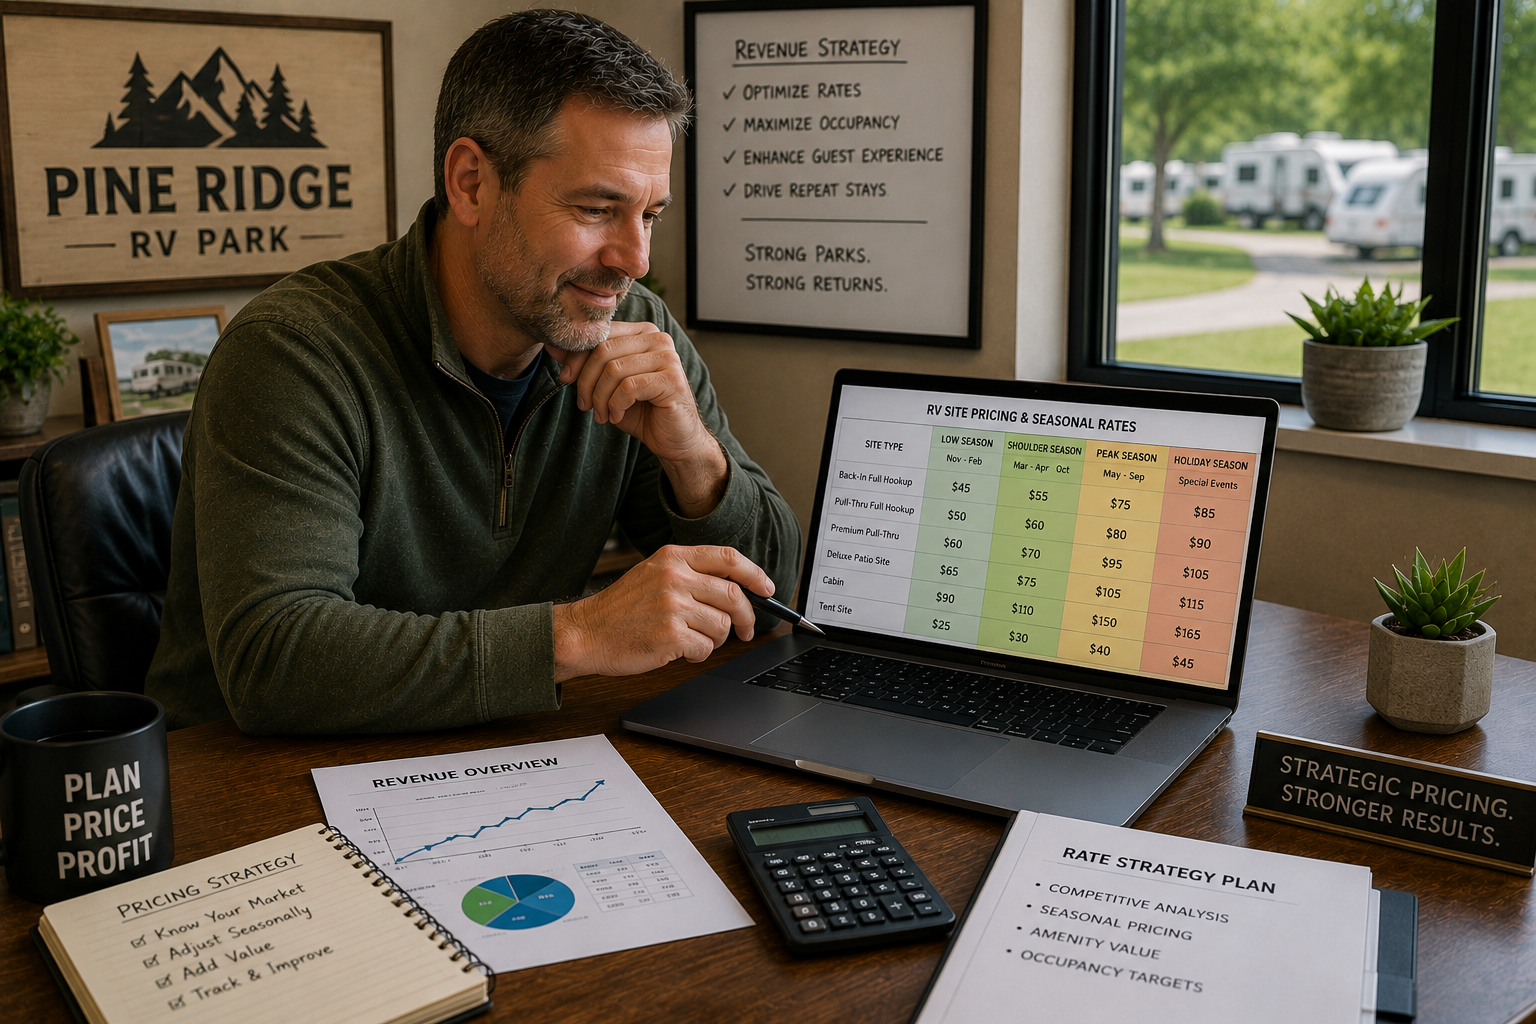
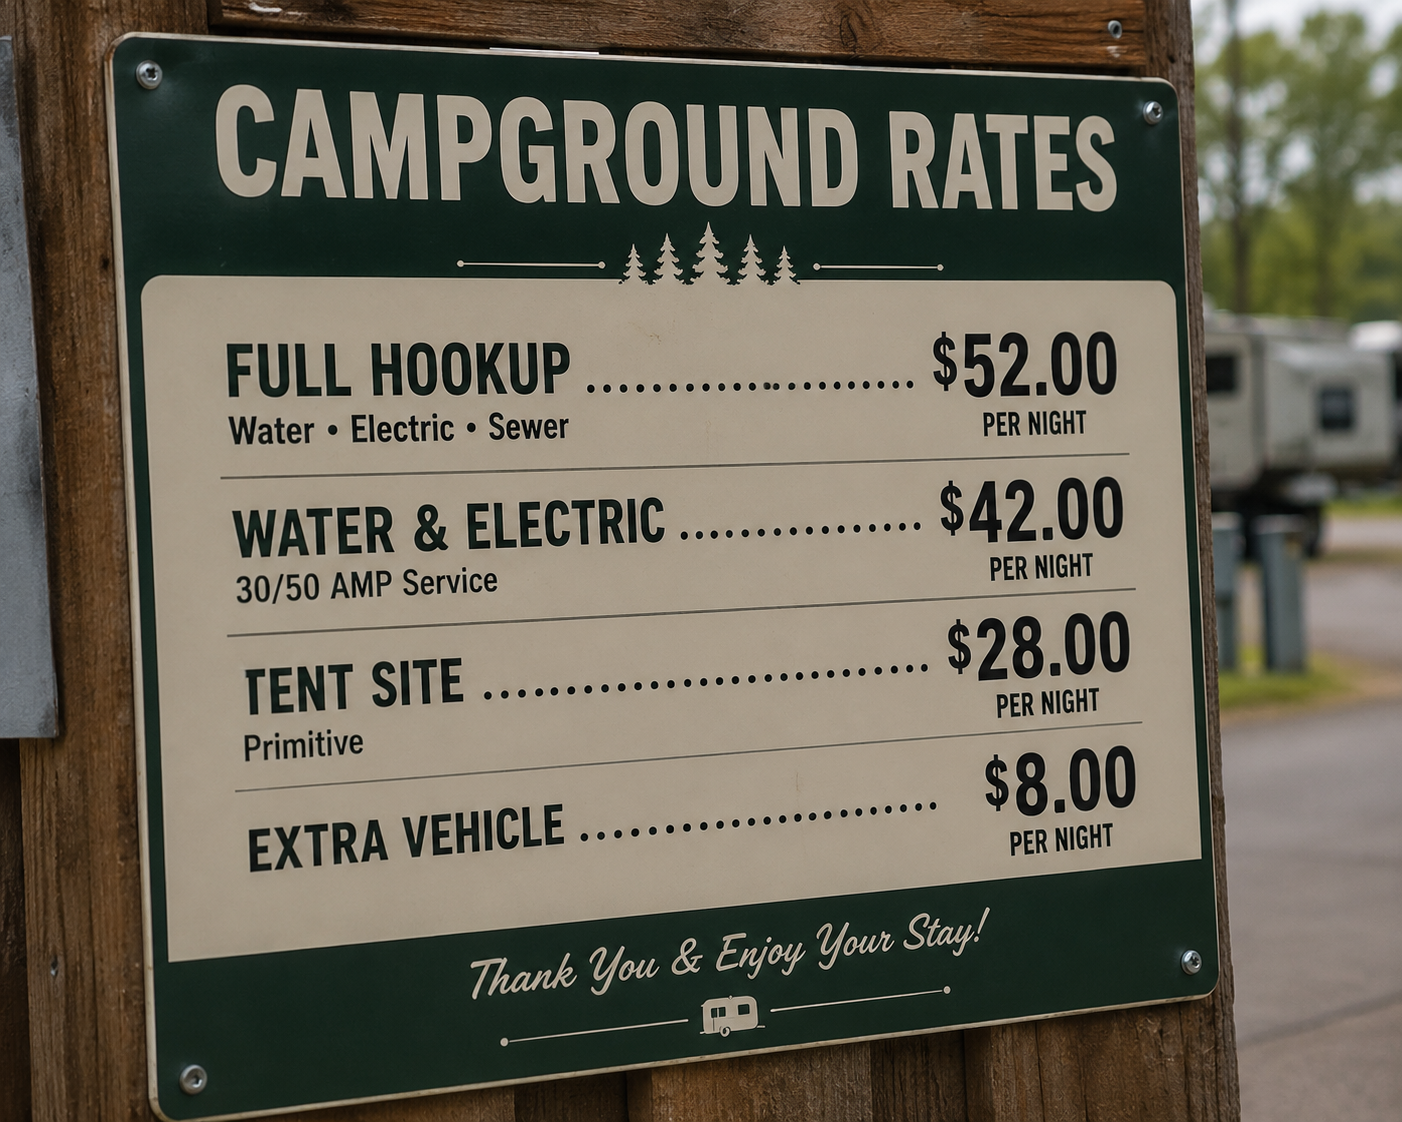
It means protecting the guest experience while still hitting your financial targets. This is where the cost cutting playbook falls short. RV park operations done well means finding efficiencies that do not erode the experience your guests are paying for, not stripping amenities until the reviews turn. If pricing decisions are part of what feels shaky right now, my posts under Revenue and Pricing walk through how to adjust rates without damaging the guest experience.
How to Actually Prepare for RV Park Operations, Not Just Diligence
Build your operating plan before you close, not after. Your rules, your staffing structure, your maintenance schedule, and your guest communication standards should exist in writing before you take over the property, not get figured out reactively in your first month.
Separate your diligence team from your operating mindset. It is easy to let the excitement of a clean diligence report convince you the hard part is over. Treat closing as the starting line for RV park operations, not the finish line for the deal.
Plan for enforcement, not just for policy. Writing a rule and enforcing a rule are two different skill sets. Decide before you close how you or your manager will actually handle the first rule violation, not just what the rule says.
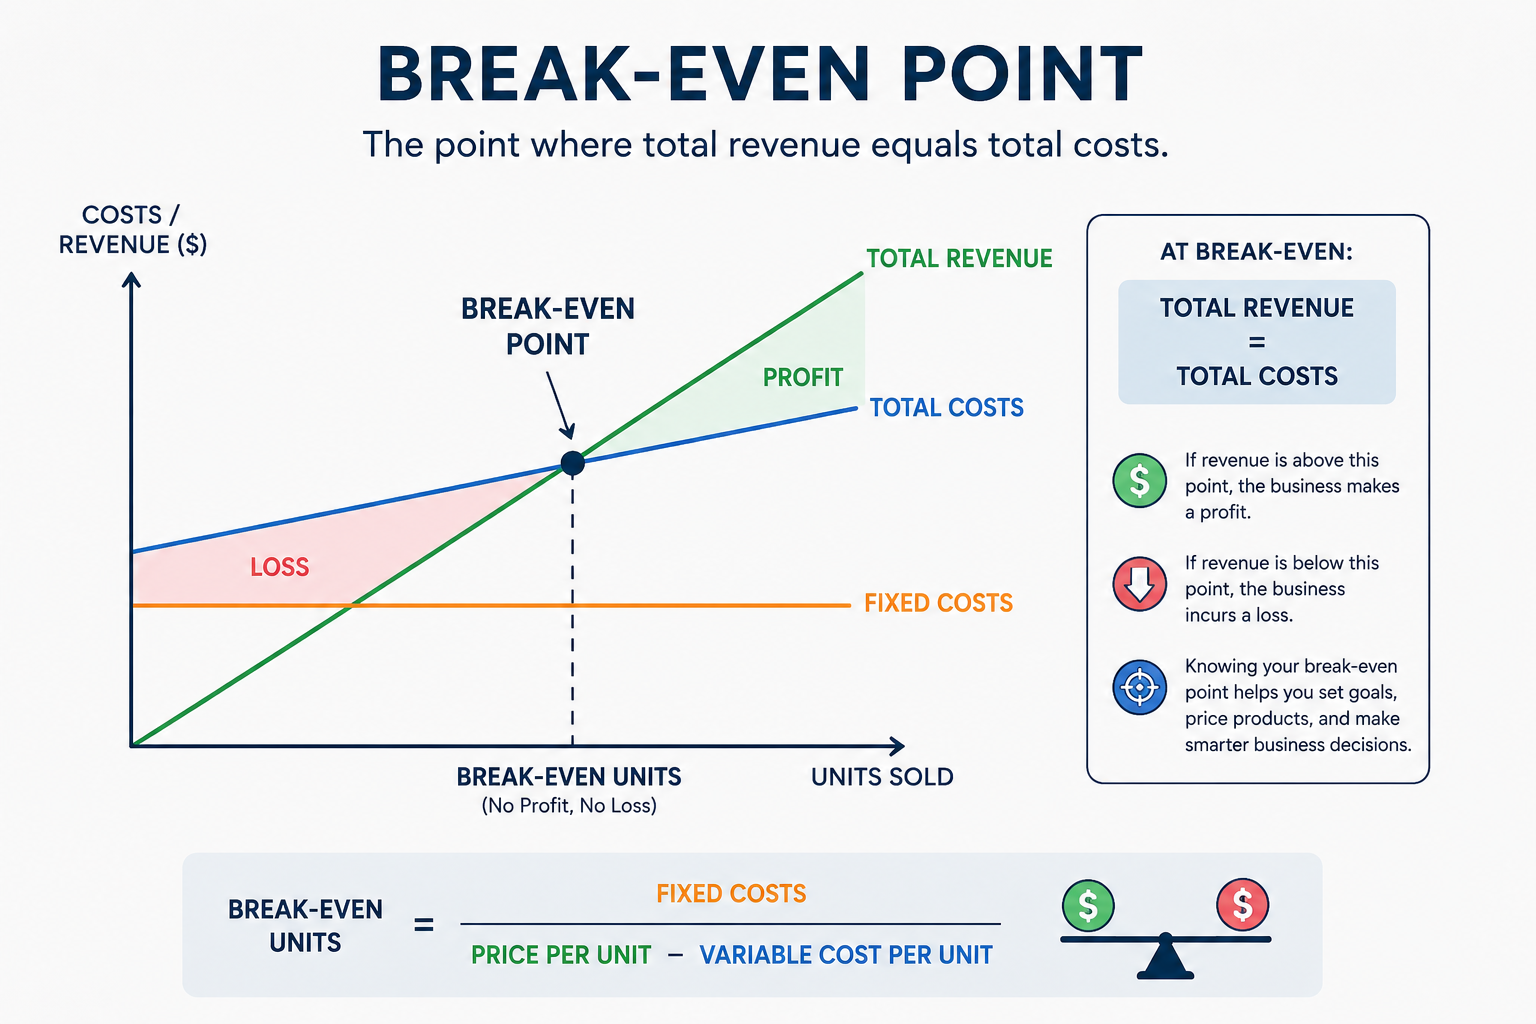
Budget for the season you are worst prepared for, not the season you are picturing. Most new owners plan around their best month. RV park operations means planning your cash reserves and staffing around your worst month, because that is the month that actually tests your business. The SBA’s guide on managing your finances is a solid outside resource if you want a general framework before layering in the RV park specific numbers.
Get help with the parts of RV park operations that are not your strength. Some owners are great with guests but struggle with the financial side. Others can run a spreadsheet in their sleep but freeze up during a difficult guest conversation. Know which one you are, and build a team around the gap. If bookkeeping and financial systems are the weak link in your RV park operations, that is exactly what I cover in my Bookkeeping and Financial Systems posts.
RV park operations is where the actual business lives. Due diligence tells you whether the property is worth buying. Operations tells you whether you can run it well once you own it, and that second question matters just as much as the first one, even though almost nobody writing acquisition content spends real time on it. If you are further along in the buying process, treat your diligence checklist as the beginning of your RV park operations plan, not a substitute for one.
If you are working through an acquisition right now and want help building an operating plan alongside your diligence process, not after it, that is exactly the kind of work I do. Reach out at PVIFinancial.com.
For more on running a profitable, well managed park, check out my Resource Library, and grab a copy of my book From Offer to Operation: The Complete RV Park Investor’s Guide, also available on Amazon.
~Wendi | Fractional CFO | PVIFinancial.com