Category: Cash Flow Managment

  • RV Park Reserve: 6 Essential Steps to Build a Debt Service Cushion Before Your Off Season Hits

    RV Park Reserve: 6 Essential Steps to Build a Debt Service Cushion Before Your Off Season Hits

    An RV park reserve is not optional if you own a seasonal business, and yet most owners never build one on purpose. They assume the strong months will carry them through the weak ones, and then February arrives and the reserve that was supposed to exist turns out to be whatever happened to be left in the checking account.

    That is not a reserve. That is luck, and luck runs out.

    Why an RV Park Reserve Matters More Than You Think

    Nationwide research on small business cash reserves paints a sobering picture. The median small business holds just 27 cash buffer days in reserve, meaning half of all small businesses hold an average daily cash balance that would cover fewer than four weeks of outflows if their income stopped. For a seasonal business like an RV park, where entire months can pass with minimal transient revenue, 27 days of cushion is nowhere near enough. JPMorgan Chase

    Real estate businesses tend to hold more cushion than the median, but an RV park reserve still has to be built deliberately. It does not happen by accident, and it does not happen just because your peak season was strong.

    Step 1: Calculate Your True Off Season Burn Rate

    Before you can size a reserve, you need to know exactly what your park costs to run during your slowest months. Pull your operating expenses for your worst two or three consecutive months and treat that number as your baseline burn rate, not your annual average.

    Step 2: Set Your RV Park Reserve Target in Months, Not Dollars

    A dollar figure that sounded like plenty two years ago may not cover today’s costs. Set the target as a number of months of off season burn rate instead, typically three to six months depending on how severe your seasonality runs. Revisit that target every year as your expenses change.

    Step 3: Separate the Reserve From Your Operating Account

    Reserve funds that live in the same account as daily operating cash get spent. It happens gradually and it happens without anyone deciding to do it. Move your RV park reserve into a separate account entirely, ideally one that is slightly harder to access than a debit swipe.

    Step 4: Fund It During Peak Season on Purpose

    Do not wait to see what is “left over” at the end of a strong month. Build a specific transfer into your peak season monthly financial review that moves a set percentage of revenue directly into the reserve before anything else gets spent.

    Step 5: Stress Test the Reserve Against Your Worst Month, Not Your Average Month

    Your RV park reserve needs to hold up against the worst month your books have actually shown, not a smoothed average across the year. If it would cover an average month but fall short during your actual trough, the target is too low.

    Step 6: Keep Capital Expenses Out of It

    Your reserve exists to cover operating shortfalls, not capital expenditures. Mixing the two means you will not know your true operating cushion, and a surprise capital repair can wipe out the fund meant to carry you through a slow month. Keep separate tracking for each.

    What Happens Without a Real RV Park Reserve

    Owners without one end up making expensive decisions under pressure, drawing on high interest credit, delaying necessary maintenance, or missing a debt service payment during a slow month that a properly sized reserve would have covered without incident. A well funded RV park reserve is not a luxury for a seasonal business, it is the difference between a rough winter and a defaulted loan.

    Build it in one deliberate step at a time, fund it during your strong months, and stress test it every year against your actual worst stretch, not an optimistic average.

    If you want to go deeper on how RV park financials actually work, everything I have written on acquisitions, bookkeeping, and cash flow lives in the RV Park Resource Library. And if you want the full framework for evaluating a deal from first look through your first ninety days of ownership, that is exactly what I built into From Offer to Operation, available on Gumroad or by searching Amazon for the title.

    Full research on small business cash buffer days is available from the JPMorgan Chase Institute.

  • 5 Critical Gaps in Most RV Park Cash Flow Planning Advice

    5 Critical Gaps in Most RV Park Cash Flow Planning Advice

    RV park cash flow planning shows up in almost every buyer guide and financing blog in this industry, and it almost always says the same three things. Forecast your revenue by month. Set aside savings during peak season. Consider a line of credit for the gaps. That advice is not wrong. It is just incomplete, and incomplete cash flow advice is exactly what leaves new owners exposed the first time a slow season runs longer than expected.

    I read through a stack of these articles recently, from accounting firms, financing companies, and general outdoor hospitality blogs. Every single one told readers to build a reserve fund. Almost none of them told readers how much reserve is actually enough, or walked through what happens to that reserve once real debt service, real payroll, and a real bad season hit it at the same time. That gap is the whole reason RV park cash flow planning needs more than a checklist of good habits.

    Why Generic RV Park Cash Flow Planning Advice Falls Short

    Most of what passes for RV park cash flow planning online is small business advice with an RV park label attached to it. Forecast your revenue. Track your expenses. Keep three to six months of operating costs in reserve. That is sound general guidance, but it treats every seasonal business the same way, whether you are running a snow cone stand or a 150 site RV resort carrying a seven figure acquisition loan.

    The problem is that RV park cash flow planning done right has to account for your specific debt structure, your specific seasonality curve, and your specific capital needs, not a generic three to six month rule pulled from a small business workshop. A park with 50 percent seller financing at a fixed rate behaves completely differently under stress than a park financed with a variable rate SBA loan. A destination park with a long, predictable peak season behaves differently than a park that depends on a handful of local events to fill gaps. None of that shows up in the generic version of the advice.

    There is also a habit in this industry of treating RV park cash flow planning as something you do once, usually right after closing, and then set aside. Build the forecast, set up the reserve, move on. Real cash flow planning is not a one time exercise. It is a living model you revisit every quarter, because your occupancy trends shift, your debt service stays fixed, and your reserve either grows or shrinks depending on how disciplined you actually are between now and next season.

    What Most RV Park Cash Flow Planning Content Leaves Out

    It rarely stress tests the reserve against your actual debt service. Plenty of advice tells you to build a reserve fund. Almost none of it asks whether that reserve would survive a season where occupancy comes in 15 or 20 percent below your forecast while your mortgage, seller note, and payroll obligations stay exactly the same. RV park cash flow planning that skips this step gives you a reserve number that feels safe on paper and might not be safe at all.

    It rarely accounts for seller financing or blended debt structures. A lot of RV park deals include seller carry alongside a bank loan, sometimes with different rates, different amortization schedules, and different balloon terms. Generic cash flow advice treats debt service as one flat number. Real RV park cash flow planning has to model each piece separately, because a seller note coming due at the wrong time can undo months of careful reserve building.

    It rarely separates operating reserves from capital reserves. Most advice lumps all savings into one bucket labeled “reserve fund.” In practice, the cash you need to cover a slow month is a different pool than the cash you need for a new roof on the bathhouse or a septic repair. Blending the two is one of the fastest ways to think you are covered when you are not.

    It rarely models a downside scenario with real numbers. General cash flow guidance likes to mention planning for a slow season in the abstract. RV park cash flow planning that actually protects you means running an occupancy downside of 15 to 20 percent through your specific revenue and expense numbers and checking whether you can still make debt service and payroll without touching your capital reserve.

    It rarely connects cash flow planning back to your original underwriting. The DSCR and cash on cash return you modeled before you bought the park should not be a one time exercise you never look at again. Real RV park cash flow planning revisits those same numbers regularly and asks whether your actual performance still supports the assumptions you underwrote at purchase.

    How to Build RV Park Cash Flow Planning That Actually Holds Up

    Separate your reserves into two buckets. Keep an operating reserve sized to cover a genuinely bad season, and a separate capital reserve sized to cover deferred maintenance and unexpected capital repairs. If you are still working through your acquisition, my posts under Acquiring an RV Park walk through how to size capital reserves during due diligence, before you are relying on guesswork after closing.

    Run a real downside scenario, not a vague one. Take your actual monthly revenue and expense numbers and model a 15 to 20 percent occupancy shortfall through the slowest months of your season. If your reserve and your debt service do not both survive that scenario on paper, RV park cash flow planning has more work to do before you feel comfortable.

    Model your debt service piece by piece, not as one number. If you are carrying seller financing alongside a conventional loan, map out exactly when each payment is due, at what rate, and when any balloon comes due. I covered a version of this kind of blended debt modeling in my post on RV park rule enforcement, where the same discipline of not treating everything as one flat category matters just as much for staffing decisions as it does here for debt.

    Revisit your numbers quarterly, not once a year. RV park cash flow planning is a living process. If your occupancy trend is drifting from what you modeled at acquisition, that is information you want three months into a slow trend, not nine months in when the reserve is already thin. My Fractional CFO Services work with clients on exactly this kind of ongoing quarterly review.

    Get your bookkeeping clean enough to trust the numbers you are modeling. None of this works if your monthly financials are inconsistent or delayed. If your books are not giving you a reliable, current picture, my Bookkeeping and Financial Systems posts cover how to get that foundation solid first.

    Pressure test your pricing before you lean on debt to fill the gap. Sometimes the fastest way to strengthen a cash flow position is smarter seasonal pricing rather than a bigger reserve. My Revenue and Pricing posts go deeper into adjusting rates without hurting your guest experience or your occupancy.

    RV park cash flow planning is not a box you check with a generic reserve fund and a monthly forecast spreadsheet. It is a specific, ongoing discipline built around your actual debt structure, your actual seasonality, and your actual downside risk. The advice that stops at “build a reserve fund” leaves out the exact math that tells you whether your reserve would actually survive the season that tests it.

    If you want your RV park cash flow planning built around your real numbers instead of a generic small business rule of thumb, that is exactly the kind of modeling I do with clients. The SBA’s own guidance on managing your finances is a useful general starting point if you want an outside framework, found at sba.gov, but it is written for small businesses broadly, not RV parks specifically, so layering the seasonal and debt structure detail on top is where the real protection comes from.

    If you want help stress testing your reserve, modeling your debt service, or building a cash flow plan that actually holds up in a bad season, that is exactly the kind of work I do. Reach out at PVIFinancial.com.

    For more on running a profitable, well managed park, check out my Resource Library, and grab a copy of my book From Offer to Operation: The Complete RV Park Investor’s Guide, also available on Amazon.

    ~Wendi | Fractional CFO | PVIFinancial.com

  • RV Park Cash Flow Management: 7 Strategies That Stop Your Park from Sinking in the Off Season

    RV Park Cash Flow Management: 7 Strategies That Stop Your Park from Sinking in the Off Season

    RV park cash flow management is the skill most new owners do not think about until they are staring at a near-empty bank account in February wondering where all the summer money went. The good news is it is not complicated once you have a system. The bad news is almost nobody teaches you the system when you close. The owners who master RV park cash flow management are the ones who are never caught off guard, no matter what the calendar looks like.

    This post gives you that system, step by step, so you can stop guessing and start managing your money the way the numbers actually work in this business.

    Here is that system, seven strategies that keep your cash flow working for you all year:

    1. Know your baseline number before the season starts

    RV park cash flow management starts with one number: your monthly fixed cost floor. This is what it costs you to keep the lights on, the staff paid, the insurance current, and the debt serviced regardless of how many guests are in the park.

    Here is how to find it:

    Add up every expense that hits every single month no matter what. Mortgage or debt service, insurance, utilities on common areas, any salaried staff, software subscriptions, and any loan payments. Do not include variable expenses yet, just the fixed ones.

    That number is your floor. Every month your revenue needs to clear that number or you are dipping into reserves. Write it down and put it somewhere you see it every week. It is the most important number in your business.

    2. Build a 12 month cash flow map in January

    Sit down in January, before your season ramps up, and map out every single month of the year. For each month write down:

    • Expected revenue based on prior year occupancy
    • Fixed expenses
    • Variable expenses you know are coming, maintenance cycles, seasonal staff, marketing pushes
    • Any big one-time costs, equipment, capital improvements, permit renewals

    Now look at where the gaps are. Most parks will show three to four months where expenses exceed revenue. Those months are not surprises, they are scheduled. Once you can see them on paper you can plan for them instead of reacting to them.

    This map does not have to be fancy. A simple spreadsheet with 12 columns, one per month, and rows for each income and expense category is all you need. If you want to see what a clean version of this looks like, How to Do Your Monthly Financial Review: A Step by Step Guide for RV Park Owners is a good starting point.

    3. Open a dedicated cash flow reserve account

    This is the single most impactful thing you can do for RV park cash flow management and most owners skip it entirely.

    Open a separate bank account, not your operating account, and call it your Cash Flow Reserve. Every month during peak season transfer a fixed amount into it. The amount depends on your gap months but a good starting target is enough to cover two to three months of your fixed cost floor.

    Here is the rule: that account is only for covering shortfalls during slow months. It is not for equipment purchases, not for improvements, not for anything else. It is your seasonal buffer and it needs to be off limits for everything except its one job.

    If you are not sure how much to set aside, take your total slow season shortfall from your 12 month map and divide it by the number of peak months you have. That is your monthly transfer amount.

    4. Pay your slow season bills with your peak season revenue

    This sounds obvious but most owners do not actually do it systematically. RV park cash flow management works best when you think of your peak season revenue as covering the whole year, not just the months it comes in.

    Here is a simple way to think about it. If you know November through February will cost you $15,000 more than you bring in across those four months, then your summer needs to generate that $15,000 on top of covering summer expenses. That means your summer pricing, occupancy targets, and ancillary revenue need to account for the slow season too.

    When you set your rates for the season, back into them from your annual number, not just your summer number. Most owners price for summer and hope for the best in winter. Owners who are good at RV park cash flow management price for the whole year.

    5. Create a 90 day rolling cash flow forecast

    Your 12 month map is your big picture plan. Your 90 day rolling forecast is your operational tool.

    Every month update a simple three month look ahead. Take your actual bank balance today, add expected revenue for the next 90 days based on reservations and historical occupancy, subtract every known expense in that window, and see what your ending balance looks like.

    If the ending balance is below your fixed cost floor you have a problem coming and you have 90 days to address it. That might mean a promotional push to fill shoulder season inventory, deferring a non-urgent expense, or drawing from your reserve account.

    The 90 day forecast is where RV park cash flow management goes from theory to action. Do this on the first of every month without fail. It takes about 30 minutes once you have the habit and it will never let a cash crisis sneak up on you again. For more on what to review every month read The Monthly Financial Review Every RV Park Owner Should Be Doing But Almost Nobody Does.

    6. Track revenue per available site every single week

    Most owners track total revenue. Smart RV park cash flow management tracks revenue per available site, or RevPAS, because it tells you whether your pricing and occupancy are actually working together.

    Here is how to calculate it:

    Take your total revenue for the week and divide it by the number of sites you have available multiplied by 7 days. That gives you your RevPAS for the week.

    If your RevPAS is dropping it means either your occupancy is falling, your rates are too low, or both. If it is climbing you are doing something right and you want to know what so you can keep doing it.

    Track this number weekly during peak season and monthly during slow season. Put it in a simple log next to your cash flow forecast. Over time it becomes one of the most useful signals you have for understanding whether your revenue engine is healthy. I wrote more about this metric in The Three Numbers That Expose Every Problem in Your RV Park Before It Costs You Money.

    For industry benchmarking on occupancy and revenue data, RV Industry Association is a good resource.

    7. Do a monthly cash flow check in, not just a bank balance check

    Checking your bank balance is not RV park cash flow management. It is a snapshot of one moment in time and it tells you almost nothing about what is coming.

    A real cash flow check in takes about 20 minutes once a month and covers four things:

    First, compare actual revenue to what you projected for the month. Were you above or below and why?

    Second, compare actual expenses to what you projected. Were there any surprises and are they one-time or recurring?

    Third, update your 90 day rolling forecast with the new actuals.

    Fourth, check your reserve account balance against your projected slow season needs. Are you on track or do you need to adjust your transfer amount?

    That is it. Four questions, 20 minutes, once a month. If you do nothing else from this post, do this. It is the foundation of solid RV park cash flow management and it will tell you everything you need to know about the financial health of your park before a problem becomes a crisis.

    If you want help setting up your cash flow system, building your 12 month map, or doing a monthly review alongside someone who has done this with real parks, that is exactly what I do. Reach out at PVIFinancial.com and let’s get your numbers working for you.

    ~Wendi | Fractional CFO | PVIFinancial.com

  • Your Park Is Full But Your Cash Flow Is Not. Here Is Why Shoulder Season Changes Everything.

    Your Park Is Full But Your Cash Flow Is Not. Here Is Why Shoulder Season Changes Everything.

    There is a moment almost every RV park owner has experienced at least once. You look at your occupancy numbers for the month and they look fine. Maybe even good. Then you look at your bank account and something does not add up. The park feels busy but the money does not feel right. If that has happened to you, shoulder season is almost certainly part of the explanation.

    Most RV parks are designed financially around peak season. The summer months carry the revenue, cover the debt service, and ideally leave something behind for reserves and operations during the slow months. That model worked reasonably well when peak demand was strong enough to make up for everything else. But in a maturing market with flat growth projections, parks that are still running on a peak-season-only financial model are leaving significant money on the table and taking on more risk than they realize.

    Shoulder season, those weeks in spring and fall that are not quite summer but not quite dead either, is where the financial story of your park actually gets written. Here is why it matters so much more than most operators think, and what your financials need to show if you want to capture it.

    Why Shoulder Season Is a Financial Multiplier

    Your fixed costs do not take shoulder season off. Your mortgage, your insurance, your property taxes, your minimum staffing, your utility base load, these expenses run every month regardless of how many guests are on property. When peak season carries all the revenue, those fixed costs are essentially being front-loaded onto a narrow window. If anything disrupts that window, a bad weather stretch, a slow booking year, a competitor opening nearby, your entire financial model is exposed.

    Shoulder season revenue is different from peak season revenue in one critical way. Because your fixed costs are already covered or mostly covered by peak occupancy, every dollar that comes in during shoulder season carries an outsized contribution to your bottom line. You are not paying for the mortgage again. You are not paying for insurance again. You are adding incremental revenue against a cost base that is already in place. That is what makes shoulder season a financial multiplier, and why operators who have learned to capture it tend to have materially stronger NOI than those who have not.

    A park generating $50,000 in shoulder season revenue it was not capturing before does not just add $50,000 to its top line. It adds most of that $50,000 directly to NOI, because the expenses that would have eaten it during peak season are already absorbed. At a 10% cap rate, that $50,000 in additional NOI translates to $500,000 in added park value. From shoulder season.

    What the Data Is Telling Us Right Now

    The shift toward stronger shoulder seasons is not just anecdotal. Industry data for 2026 points to what analysts are calling shoulder season strengthening, driven specifically by three groups of guests who do not follow the traditional summer camping calendar.

    Remote workers and digital nomads have decoupled travel from the school calendar entirely. They can leave in April, stay through October, and actually prefer the less crowded experience that shoulder season offers. Extended stay guests, including workforce housing residents and traveling professionals, create occupancy that has nothing to do with summer at all. And retirees, one of the fastest growing segments in the RV market, have complete schedule flexibility and often specifically avoid the peak summer crowds.

    If your park is not set up to attract and accommodate these guests during shoulder months, you are watching revenue walk past you to a park that is. The financial question is not whether shoulder season demand exists. It clearly does. The question is whether your operation and your financial setup are positioned to capture it.

    What Capturing Shoulder Season Actually Requires

    This is where I want to get specific, because shoulder season revenue does not just happen because you leave the gate open a few extra weeks. It requires deliberate operational and financial decisions, and those decisions need to show up in your budget and your monthly reporting.

    Pricing strategy is the starting point. Many parks run a single rate all season or have a basic peak and off-peak split. That is not enough to optimize shoulder season. You need tiered pricing that reflects actual demand patterns, with shoulder season rates set at a level that is attractive enough to drive bookings but not so discounted that you undermine your peak perception. Dynamic pricing tools can help with this, but even a simple manually managed rate calendar is better than nothing.

    Amenity availability matters more in shoulder than in peak. In summer, guests come regardless because demand is high. In shoulder season, guests are choosing between you and a hotel, between you and staying home, between you and a park that marketed to them. If your bathhouse is closed, your laundry is winterized, and your office is unstaffed on weekdays, you are telling that guest to go somewhere else. The operational cost of staying open through shoulder season is real, but it is almost always lower than the revenue you are leaving behind.

    Marketing timing is something almost no small park operator gets right. Most marketing budgets and efforts are pointed at summer bookings. But shoulder season guests book on shorter lead times and respond to specific messaging about the experience of visiting when the park is quieter, the weather is comfortable, and the rate is lower. If you are not actively marketing to them in late February for April stays and in late July for September stays, you are missing the window.

    How This Shows Up in Your Financials

    Here is the part that most blog posts about shoulder season skip entirely. Capturing shoulder season revenue requires you to track it separately so you can actually measure whether your efforts are working.

    Your monthly P&L should show you revenue by month so you can see your seasonal distribution clearly. If you are pulling in 85% of your revenue in June, July, and August, your shoulder season capture rate is low and your financial model is fragile. If you can move that to 70% peak and 30% shoulder over two to three years through deliberate effort, your cash flow is more stable, your NOI is stronger, and your park is worth more.

    I also want to see a break-even analysis that accounts for shoulder season specifically. What does occupancy need to be in April and May to cover your operating expenses in those months without drawing down reserves? That number is usually lower than operators expect, because fixed costs are spread across the whole year and variable costs in shoulder season are modest. Knowing your shoulder season break-even gives you a clear target to manage toward rather than just hoping the numbers work out.

    Finally, if you are investing in anything to improve shoulder season performance, whether that is improved Wi-Fi for remote workers, year-round bathhouse upgrades, or a targeted marketing campaign, that investment needs to be in your budget as a line item with an expected return. Too many operators make these investments informally and then have no way to evaluate whether they paid off. Put it in the budget, track the revenue it was intended to generate, and compare the two at year end. That is how you make better decisions next year.

    Shoulder season will not save a fundamentally broken financial model. But for a park that is well-run and paying attention, it is one of the clearest paths to stronger NOI and more stable cash flow in a market that is no longer going to hand you growth automatically.

    Read this next: The Thing That Kills Cash Flow After You Close (That Has Nothing to Do With Revenue)


    I cover cash flow planning and seasonal financial management for RV park owners in ๐—™๐—ฟ๐—ผ๐—บ ๐—ข๐—ณ๐—ณ๐—ฒ๐—ฟ ๐˜๐—ผ ๐—ข๐—ฝ๐—ฒ๐—ฟ๐—ฎ๐˜๐—ถ๐—ผ๐—ป: ๐—ง๐—ต๐—ฒ ๐—–๐—ผ๐—บ๐—ฝ๐—น๐—ฒ๐˜๐—ฒ ๐—ฅ๐—ฉ ๐—ฃ๐—ฎ๐—ฟ๐—ธ ๐—œ๐—ป๐˜ƒ๐—ฒ๐˜€๐˜๐—ผ๐—ฟ’๐˜€ ๐—š๐˜‚๐—ถ๐—ฑ๐—ฒ ($49). Available at wendipvifinancial.gumroad.com/l/kqmyb and on Amazon under my name, Wendi Rook.

  • 5 Financial Warning Signs Your RV Park Won’t Survive the RV Park market slowdown.

    5 Financial Warning Signs Your RV Park Won’t Survive the RV Park market slowdown.

    The RV park market slowdown was not on anyone’s radar during the boom years. If you got into parks between 2020 and 2025 you probably heard some version of this pitch: the industry is exploding, demand is up, new campers are flooding in, this is the best time to buy. And that was true. The industry grew at over 8% annually during that stretch. Occupancy was strong, rates were rising, and parks that were barely functional were still generating solid returns because the tide was lifting everything

    That tide has leveled off. Industry projections now point to near-zero growth through 2030, with some forecasts showing a slight revenue decline over that period. That does not mean RV parks are a bad investment. It means the era where a mediocre operation could hide behind a rising market is over. If your park is going to perform well in a flat market, it has to be built to perform, not just to exist.

    This post is about what that actually means for your financials, and the specific things I look at when I am evaluating whether a park is positioned to hold its ground or slowly erode in a maturing market. Here is what we are going to be looking at:

    What a RV Park Market Slowdown Actually Means for Your NOI

    In a growth market, you can count on some level of natural rate and occupancy increase year over year even if you do nothing. Demand is outrunning supply, so guests come to you. In a flat market, that tailwind disappears. Your NOI does not grow unless you make it grow, and your expenses will almost certainly keep climbing regardless of what revenue does.

    Utilities, insurance, labor, property taxes, and maintenance costs do not plateau just because the market does. If your revenue is flat and your expenses are rising 3 to 5 percent per year, your NOI is shrinking. A shrinking NOI means a shrinking valuation. This can happen slowly enough that you do not notice it until you are sitting across from a buyer or a lender and wondering why the number is lower than you expected.

    The parks that hold their value in a flat market are the ones where the operator is actively managing the spread between revenue and expenses, not just running the park and hoping the numbers work out at year end.

    The Metrics That Matter More Now Than They Did in 2021

    When the market was growing, occupancy was the headline number. If your park was full, you were fine. In a maturing market, occupancy is still important but it is not sufficient on its own. Here are the metrics I focus on with clients when we are trying to understand whether a park is truly healthy or just appears healthy.

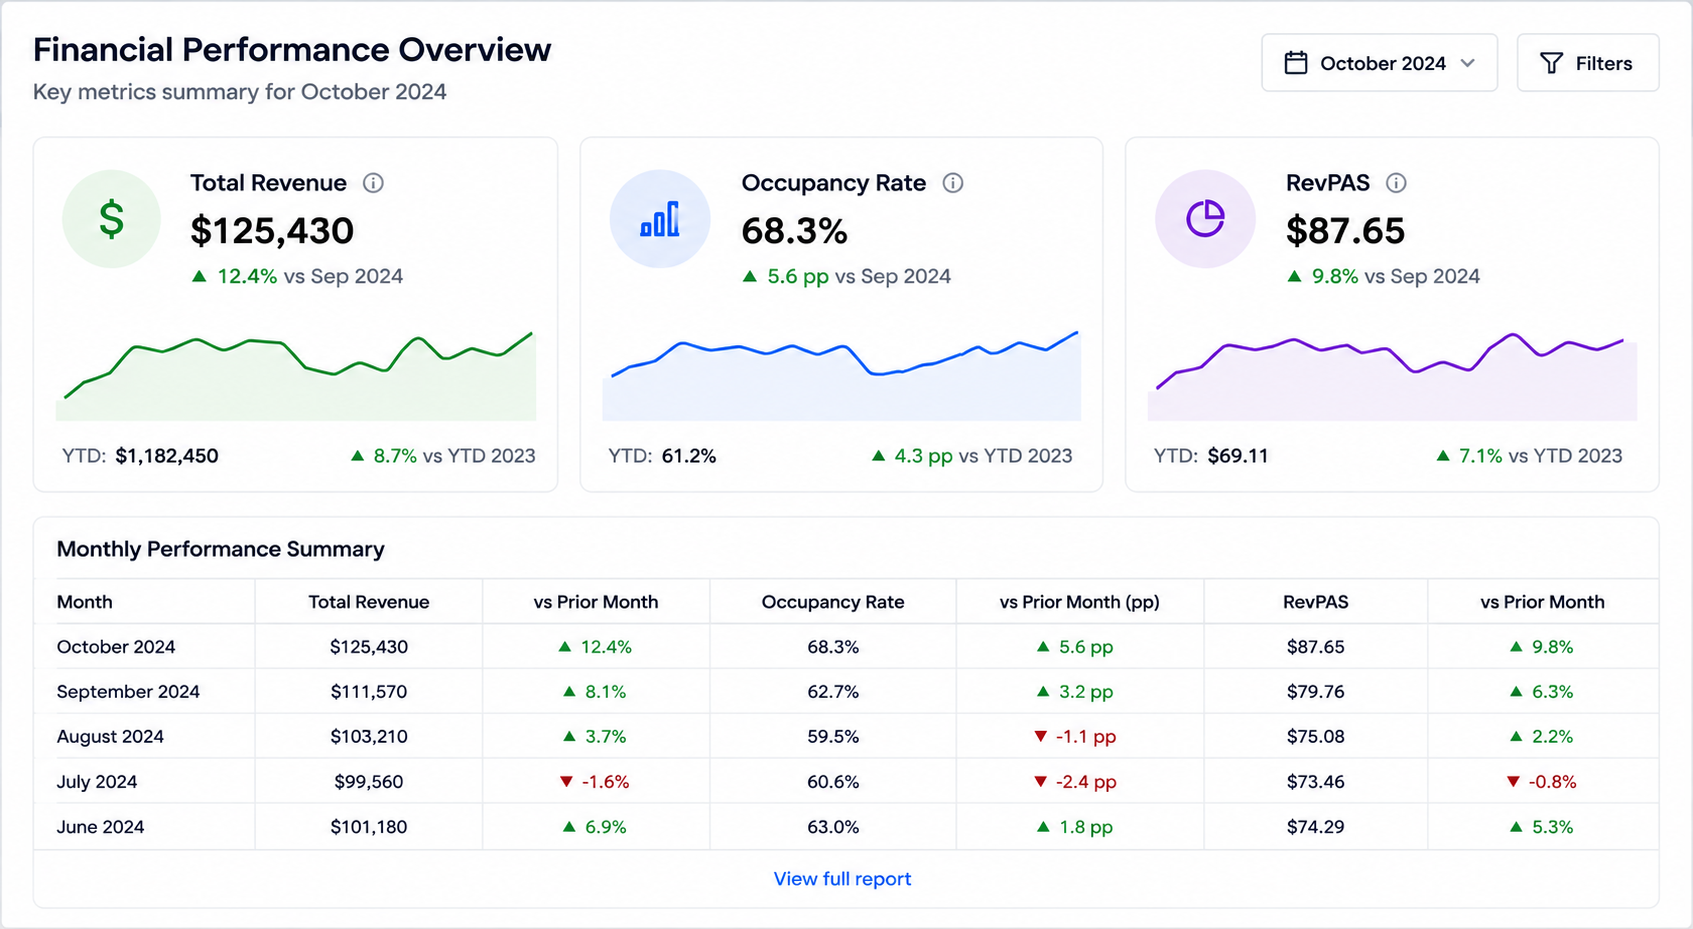
    Revenue per available site, or RevPAS, tells you how much income you are generating from each site on average across the entire season, including empty nights. A park with 70% occupancy and a strong RevPAS is in a different position than a park with 70% occupancy and a weak one, usually because of rate, ancillary income, or both. If you are not tracking RevPAS you are missing a key layer of the story.

    Expense ratio is your total operating expenses divided by total revenue. In a well-run park this typically runs between 50 and 65 percent. If you are above 70 percent, your margins are thin and any revenue softness hits you hard. If you do not know your expense ratio off the top of your head, that is the first thing to calculate.

    Operating cash flow, separate from your accounting profit, tells you how much actual cash the business is generating after all operating expenses and debt service. Parks can look profitable on a P&L and still be cash-flow negative because of debt structure, deferred maintenance that is now hitting, or working capital gaps. In a flat market, cash flow discipline is everything.

    Where Operators Lose Ground Without Realizing It

    The most common pattern I see in a slowing market is what I call the quiet squeeze. Revenue holds roughly flat. The operator feels okay because nothing is obviously wrong. But expenses creep up, deferred maintenance starts accumulating, a rate increase gets skipped because it feels risky, and three years later the NOI is meaningfully lower than it was even though the park looks the same from the outside.

    The quiet squeeze is dangerous because it is gradual. You do not feel it the way you would feel a sudden drop in occupancy. You feel it when you go to refinance and the appraisal comes in lower than you expected. You feel it when a buyer makes an offer based on your actual current NOI and it is not the number you had in your head.

    The antidote is a monthly financial review that actually looks at trends, not just snapshots. I want to see revenue month over month, expense categories month over month, and NOI quarter over quarter for at least the last two years. Trends tell you things that a single month never will.

    The Operational Moves That Protect You in a Flat Market

    Surviving a plateau is not about dramatic reinvention. It is about getting very intentional about the levers you control. Here is where I focus with clients who are trying to protect their position in a maturing market.

    Rate discipline matters more than it ever did. If you have not raised rates in two years, your real revenue is declining when you factor in inflation. Even a 5 to 8 percent annual increase on new reservations keeps you moving in the right direction without shocking your regulars.

    Ancillary revenue becomes a meaningful line item. In a boom market you did not need it. In a flat market, income from storage, laundry, firewood, propane, on-site activities, or cabin rentals can be the difference between an NOI that grows and one that stagnates. These revenue streams also tend to carry high margins because your fixed costs are already covered by site revenue.

    Expense management has to be active, not passive. I review every major expense category with my clients quarterly, looking specifically for costs that have crept up without a corresponding increase in value. Insurance is a frequent culprit. So are utility costs that could be partially billed back to guests. So is software that was added during the busy years and never evaluated for ROI.

    Capital expenditure planning becomes critical. Deferred maintenance is the silent killer of NOI in a flat market. Every year you skip a repair or replacement that needs to happen, you are borrowing from your future self. When it finally comes due, it hits the P&L all at once, and it is never at a convenient time. I help clients build a rolling 3-year capital expenditure forecast so they can see what is coming and plan for it rather than react to it.

    What This Means for Your Financial Reporting

    If your books are currently set up to track revenue and expenses at a basic level and spit out a P&L once a month, that was probably sufficient when the market was doing the heavy lifting. It is not sufficient now.

    In a flat market, you need financial reporting that shows you trends over time, breaks out revenue by type and site category, tracks your key metrics monthly, and gives you enough visibility to make decisions before problems become emergencies. That is not complicated to build, but it does require intentional setup. If you are not sure whether your current reporting is giving you what you need, that is worth finding out sooner rather than later.

    The parks that will do well through this plateau are not necessarily the ones with the best locations or the newest amenities. They are the ones with operators who are paying attention and managing with intention. That starts with your numbers.

    Read this next: The Monthly Financial Review Every RV Park Owner Should Be Doing (But Almost Nobody Does)


    I cover what healthy RV park financials look like at every stage of ownership in ๐—™๐—ฟ๐—ผ๐—บ ๐—ข๐—ณ๐—ณ๐—ฒ๐—ฟ ๐˜๐—ผ ๐—ข๐—ฝ๐—ฒ๐—ฟ๐—ฎ๐˜๐—ถ๐—ผ๐—ป: ๐—ง๐—ต๐—ฒ ๐—–๐—ผ๐—บ๐—ฝ๐—น๐—ฒ๐˜๐—ฒ ๐—ฅ๐—ฉ ๐—ฃ๐—ฎ๐—ฟ๐—ธ ๐—œ๐—ป๐˜ƒ๐—ฒ๐˜€๐˜๐—ผ๐—ฟ’๐˜€ ๐—š๐˜‚๐—ถ๐—ฑ๐—ฒ ($49). Available at wendipvifinancial.gumroad.com/l/kqmyb and on Amazon under my name, Wendi Rook.

  • You Bought at the Peak: 4 Things Your RV Park Financials Need to Show Right Now

    You Bought at the Peak: 4 Things Your RV Park Financials Need to Show Right Now

    Your RV park financials need to tell a clear, accurate story right now, especially if you bought between 2020 and 2022 at peak prices. That is just the reality. Occupancy was record high, interest rates were low, and sellers knew exactly what they had. You probably paid a multiple that made sense at the time, and maybe it still does. But the market has shifted. Debt costs are higher, operating expenses have climbed, and the post-pandemic camping surge has normalized. If your financials are not telling a clear, accurate story right now, you are sitting on a risk you may not fully see yet.

    This is not doom and gloom. It is a call to get eyes on your numbers before someone else does it for you, whether that is a lender, a partner, or a buyer.

    Here is what I look for when I work with park owners who acquired during the boom years.

    Your NOI needs to be real, not optimistic.

    A lot of operators track revenue well but get loose on the expense side. They forget to include a management fee even if they self-manage, they skip reserves for capital expenditures, and they leave out one-time costs that are actually recurring. If your NOI looks healthy on paper but you are always scrambling for cash, those two things are telling you something.

    Here is what a clean NOI calculation actually includes. Total site revenue plus ancillary income, minus every operating expense including a management fee of 8 to 10 percent of revenue even if you manage it yourself, minus a capital expenditure reserve of at least 3 to 5 percent of revenue, minus property taxes, insurance, utilities, payroll, marketing, software, and any other recurring cost of running the park. What is left is your real NOI. Not the number that makes the park look good. The number that tells you the truth.

    Why does this matter so much right now? Because if you ever need to refinance, bring in a partner, or sell, that NOI number is what drives your valuation. A buyer or lender will reconstruct it themselves using your actual documents. If your version and their version are significantly different, the deal either falls apart or reprices against you. Better to know your real number now than to find out at the closing table.

    Your debt service coverage ratio needs room.

    If you financed at peak prices with rates that have since risen, your DSCR may be tighter than it looks on the surface. Lenders want to see at least 1.25, and most prefer closer to 1.35 or higher. If you are sitting at 1.10 or below, you need to know that now and have a plan before your next refinance conversation.

    Let me explain how DSCR works so you can calculate yours right now. Take your real NOI, the clean number we just talked about, and divide it by your annual debt service, which is your total principal and interest payments for the year. If your NOI is $180,000 and your annual debt service is $150,000, your DSCR is 1.20. That is below what most lenders want to see and it leaves you very little cushion if revenue softens or expenses spike.

    If your DSCR is tight, you have a few levers. You can raise rates to increase NOI. You can cut expenses that are not generating value. You can add revenue through ancillary income or shoulder season capture. Or you can refinance into a longer amortization to reduce your annual debt service, though that costs you more over time. None of these are simple, but knowing your number is the first step to making a plan.

    Your revenue mix matters more than it used to.

    During the boom, parks could run on transient weekend traffic and still hit their numbers. That window is narrowing. I look at what percentage of revenue is coming from long-term stays, from shoulder season, and from ancillary income. If you are still 90 percent dependent on peak-season transient guests, your income is more fragile than your P&L suggests.

    A healthy revenue mix in a maturing market looks something like this. Peak season transient at 60 to 70 percent of total revenue. Shoulder season at 15 to 20 percent. Long-term and extended stay at 10 to 20 percent. Ancillary income, storage, laundry, propane, cabin rentals, at 5 to 15 percent. Those percentages will vary by market and park type, but the point is diversification. No single revenue stream should be carrying the entire financial model.

    If you do not know your revenue mix right now, pull your last 12 months of site revenue and break it out by month and by guest type. That one exercise will tell you more about your financial vulnerability than almost anything else you could look at.

    Your books need to be audit-ready, not catch-up ready; your RV park financials need to shine.

    If you had to hand your financials to a lender or buyer today, would they hold up? Commingled accounts, missing receipts, cash transactions that were never recorded, these are the things that kill deals and tank valuations. The time to clean them up is not when you need something. It is now, while you have runway.

    Audit-ready books mean a few specific things. Your business accounts are completely separate from your personal accounts with no commingling. Every transaction has documentation, a receipt, an invoice, a bank record that ties back to what is in your books. Your revenue matches your bank deposits and your tax returns within a reasonable margin that can be explained. Your expense categories are consistent and logical so that someone who has never seen your books can understand what they are looking at.

    If your books are not there yet, the path forward is not complicated but it does take time. Start with a bank reconciliation going back at least 12 months. Get every transaction categorized correctly. Make sure your chart of accounts reflects the actual revenue and expense categories of your business. If you are too far behind to do it yourself, hire someone to get you current. The cost of a cleanup is almost always less than the cost of a bad refinance or a repriced deal.

    Buying at the peak was not a mistake. Not knowing where you stand right now is the actual risk. Get your financials in front of someone who understands this asset class and can tell you the truth.

    If you want a second set of eyes on your numbers, that is exactly what I do.

    Read this next: What a Lender Actually Looks at Before Approving an RV Park Loan


    I cover the financial side of RV park ownership in depth in my book, ๐—™๐—ฟ๐—ผ๐—บ ๐—ข๐—ณ๐—ณ๐—ฒ๐—ฟ ๐˜๐—ผ ๐—ข๐—ฝ๐—ฒ๐—ฟ๐—ฎ๐˜๐—ถ๐—ผ๐—ป: ๐—ง๐—ต๐—ฒ ๐—–๐—ผ๐—บ๐—ฝ๐—น๐—ฒ๐˜๐—ฒ ๐—ฅ๐—ฉ ๐—ฃ๐—ฎ๐—ฟ๐—ธ ๐—œ๐—ป๐˜ƒ๐—ฒ๐˜€๐˜๐—ผ๐—ฟ’๐˜€ ๐—š๐˜‚๐—ถ๐—ฑ๐—ฒ ($49), including how to read your own financials the way a lender does. Available at wendipvifinancial.gumroad.com/l/kqmyb and on Amazon under my name, Wendi Rook.

  • RV Park Cash Flow: The 1 Month Your Books Lie to You and How to Catch It

    RV Park Cash Flow: The 1 Month Your Books Lie to You and How to Catch It

    RV park cash flow is most dangerous not in your slowest month, but in the month right after your peak season ends. Your bank account still looks healthy from the summer, your books are showing strong revenue, and everything feels like it is working.

    That feeling is the lie.

    What your books are not showing you in that moment is what is coming. The slow months ahead. The fixed costs that continue regardless of occupancy. The capital contributions you may have skipped during the rush of peak season. The reserve account that looks adequate right now and will not look adequate in February.

    The month your books lie to you the most is the first month after your best month. And if you do not know how to read what is actually there, you will make decisions based on a financial picture that is already out of date.

    Why peak season creates RV park cash flow and a false sense of security

    During peak season, cash comes in fast. Reservations are full, sites are occupied, the camp store is moving product, and the bank balance climbs in a way that feels like confirmation that everything is working. For most RV park owners, this is the best the business looks all year.

    The problem is that peak season revenue has to do more than cover peak season expenses. It has to carry the entire operation through the months when revenue drops but costs do not. Insurance does not pause in November. Loan payments do not skip January. Utilities do not stop because the sites are empty. Any year-round staff you have does not work for free in the off-season.

    If you spent peak season looking at a healthy bank balance and making decisions based on that number without modeling what the next six months actually require, you have set yourself up for a cash flow problem that will feel sudden but was entirely predictable.

    What your books are not telling you in October

    Your October P&L will show strong revenue if your peak season ran through September. It may show your best month of the year. On paper everything looks fine.

    What it will not show you is that November through March will generate a fraction of that revenue while carrying most of the same fixed costs. It will not show you the gap between what you have in the bank today and what you need in the bank to get through the slow season comfortably. It will not show you whether your reserve account is adequately funded for the capital event that always seems to happen at the worst possible time.

    A P&L is a rearview mirror. It tells you what happened. It does not tell you what is coming. And in a seasonal business, what is coming matters more than what just happened.

    The number your books should be showing you but probably are not

    The financial metric that matters most at the end of peak season is not your revenue. It is your forward cash position. Specifically, what does your cash balance need to be right now to cover every fixed expense, every debt obligation, every planned capital contribution, and a reasonable buffer for the unexpected through the end of your slow season?

    That number is not on your P&L. It is not on your balance sheet in a form most owners look at. It lives in a forward cash flow projection that most RV park owners have never built, which means most RV park owners are making post-peak-season decisions without knowing whether they can actually afford to make them.

    This is how owners end up dipping into reserve accounts to cover operating expenses in January. It is how capital projects that should have been funded from peak season revenue get deferred again. It is how a business that had a great summer ends up in a cash squeeze by spring that nobody saw coming, even though it was visible six months earlier to anyone who was looking at the right numbers.

    The seasonal cash flow trap

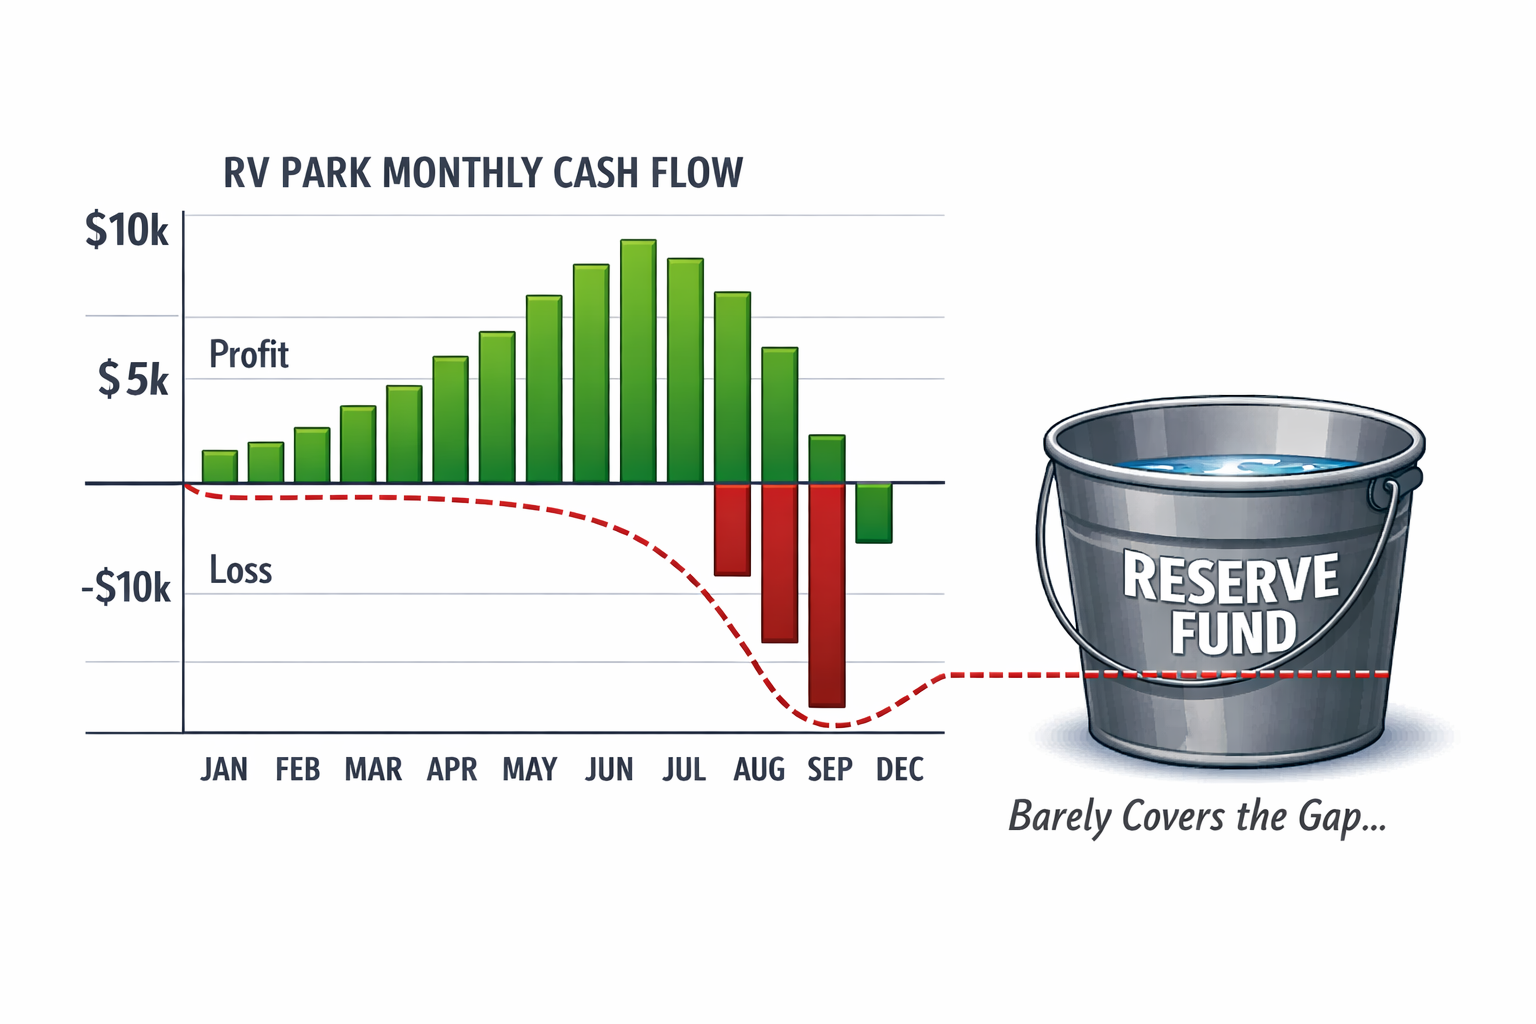
    Here is the pattern I see repeatedly. Owner has a strong peak season. Bank balance looks good in October. Owner makes a discretionary purchase, takes a distribution, or simply stops making reserve contributions because the account already looks healthy. November arrives. Revenue drops by 60 to 70 percent. Fixed costs continue. The bank balance starts declining faster than expected. By February the owner is managing cash flow week to week instead of month to month.

    The summer was not the problem. The October decision made without a forward cash flow model was the problem.

    Peak season revenue is not profit until you have confirmed it covers everything the slow season requires. Before that confirmation, it is a float.

    What to do differently

    Before peak season ends, build a month by month cash flow projection through the end of your slow season. Use your actual fixed cost structure. Use conservative revenue estimates for the slow months based on prior year performance, not hope. Calculate the cash reserve you need to carry the operation through comfortably and compare it to what you actually have.

    If the number works, great. Make informed decisions from that position. If the number does not work, you need to know that in October, not in February when the options are limited and the pressure is real.

    Your books will tell you what happened last month. Your job is to use that information to understand what is coming next. In a seasonal business those are two completely different conversations, and only one of them actually protects you.

    The month your books lie to you the most is the one where everything looks fine. That is the month to look harder.


    Read this next: The Monthly Financial Review Every RV Park Owner Should Be Doing But Almost Nobody Does


    If you want the full framework for buying, managing, and understanding the financials on an RV park acquisition, I wrote ๐—™๐—ฟ๐—ผ๐—บ ๐—ข๐—ณ๐—ณ๐—ฒ๐—ฟ ๐˜๐—ผ ๐—ข๐—ฝ๐—ฒ๐—ฟ๐—ฎ๐˜๐—ถ๐—ผ๐—ป: ๐—ง๐—ต๐—ฒ ๐—–๐—ผ๐—บ๐—ฝ๐—น๐—ฒ๐˜๐—ฒ ๐—ฅ๐—ฉ ๐—ฃ๐—ฎ๐—ฟ๐—ธ ๐—œ๐—ป๐˜ƒ๐—ฒ๐˜€๐˜๐—ผ๐—ฟ’๐˜€ ๐—š๐˜‚๐—ถ๐—ฑ๐—ฒ ($49) specifically for investors who want to get this right. You can get it direct here: https://wendipvifinancial.gumroad.com/l/kqmyb, or Amazon has it too, just search author Wendi Rook.

  • RV Park Reserve Fund Mistakes: 3 Costly Errors That Turn a Good Deal Into a Nightmare

    RV Park Reserve Fund Mistakes: 3 Costly Errors That Turn a Good Deal Into a Nightmare

    An underfunded RV park reserve fund is the silent deal killer that most buyers never see coming. The deal looked solid. The numbers worked. Due diligence got done. The deal closed. And then somewhere in the first twelve to eighteen months the cash position started tightening in ways that were not in the projections

    In most of those situations, the deal was not bad. The reserve fund was.

    What a reserve fund actually is

    A reserve fund is not a savings account you contribute to when things are going well. It is a dedicated, non-negotiable capital account funded from day one of ownership, sized to absorb the normal variability of running an operating business on a seasonal cash flow cycle.

    Most buyers understand the concept in theory. The problem is in the execution. The reserve gets underfunded at close because the down payment stretched capital further than planned. Or it gets raided in month three because a piece of equipment failed and the operating account was already running thin. Or it never gets funded at all because the buyer assumed the first season’s revenue would build it up organically.

    None of those approaches survive contact with reality.

    The three things your RV park reserve fund has to cover

    When you are sizing your reserve, you are not just planning for one type of risk. You are planning for three that can hit simultaneously.

    The first is capital expenditure. Equipment fails. Infrastructure ages. The septic pump that was fine during due diligence develops a problem in month six. A reserve fund that is not sized for capital events is not a reserve fund. It is a checking account with a different name.

    The second is operating cash flow gaps. RV parks are seasonal businesses. If your park generates most of its revenue between May and September, your reserve fund is what carries you through October, November, February, and March. The fixed costs do not stop because the guests do. Insurance, loan payments, utilities, any year-round staffing, and basic maintenance continue regardless of occupancy. If you do not have reserves sized to cover that gap comfortably, you will be making decisions under pressure during every slow season you own the park.

    The third is the unexpected. Not the dramatic unexpected, just the normal unexpected that every operating business experiences. A key employee leaves. A major OTA platform changes its algorithm and your bookings drop for sixty days while you adjust. A regional weather event cancels a peak weekend. These are not disasters. They are the cost of operating a hospitality business. Your reserve fund is what keeps them from becoming crises.

    What underfunded reserves actually look like in practice

    When a buyer closes without adequate reserves, the signs show up fast. Deferred maintenance starts accumulating almost immediately because every dollar of operating cash is needed for operations. Capital projects get pushed to next season, and then the season after that. Reviews start to reflect it before the financials do.

    The pressure compounds. A slow month creates a cash shortfall. The shortfall gets covered by skipping the reserve contribution. The next unexpected expense hits a reserve account that is already depleted. The buyer is now making every financial decision reactively instead of proactively, which is exactly the operating posture the previous owner was in when they decided to sell.

    I have seen buyers in this position within six months of closing on deals that were genuinely good acquisitions. The park was fine. The capital structure was not.

    What an adequate reserve actually looks like

    There is no universal number, but there are reasonable benchmarks. At minimum, you should close with three to six months of total operating expenses in reserve, separate from your down payment and closing costs. On top of that, any identified CapEx from due diligence should be fully funded before you close, not planned to be funded from operating cash flow after the fact.

    If your park has meaningful seasonality, size the reserve to cover your worst-case slow season cash flow gap with margin to spare. Model that number at the monthly level before you finalize your offer, not after you close.

    A good rule of thumb for ongoing reserve contributions is a minimum of five percent of gross revenue deposited monthly into a dedicated capital reserve account, treated as a non-negotiable operating expense rather than discretionary savings. That account does not get touched for operating expenses. It exists for capital events and genuine emergencies only.

    The conversation most buyers do not have before they close

    The reserve fund conversation almost never happens with the broker. It rarely happens with the lender, whose job is to get the loan closed, not to stress test your post-close capital position. It sometimes happens with a CPA, if the buyer has one engaged early enough.

    What it requires is someone looking at the full capital picture before you commit: down payment, closing costs, identified CapEx, operating reserves, and slow season cash flow requirements, all on one page, sized against the actual cash you have available to deploy.

    If that number does not work, the deal does not work, regardless of what the pro forma says.

    The buyers who close well-capitalized make decisions from a position of strength for the first two years of ownership. The buyers who close thin spend those same two years managing cash flow anxiety instead of building a business.

    The park is the same either way. The experience is not.


    Read this next: The One Financial System Every RV Park Owner Needs Before They Close


    If you want the full framework for buying, managing, and understanding the financials on an RV park acquisition, I wrote ๐—™๐—ฟ๐—ผ๐—บ ๐—ข๐—ณ๐—ณ๐—ฒ๐—ฟ ๐˜๐—ผ ๐—ข๐—ฝ๐—ฒ๐—ฟ๐—ฎ๐˜๐—ถ๐—ผ๐—ป: ๐—ง๐—ต๐—ฒ ๐—–๐—ผ๐—บ๐—ฝ๐—น๐—ฒ๐˜๐—ฒ ๐—ฅ๐—ฉ ๐—ฃ๐—ฎ๐—ฟ๐—ธ ๐—œ๐—ป๐˜ƒ๐—ฒ๐˜€๐˜๐—ผ๐—ฟ’๐˜€ ๐—š๐˜‚๐—ถ๐—ฑ๐—ฒ ($49) specifically for investors who want to get this right. You can get it direct here: https://wendipvifinancial.gumroad.com/l/kqmyb, or Amazon has it too, just search author Wendi Rook.

  • RV Park Capital Expenditures: 3 Budgeting Mistakes That Wreck New Owners in Year One

    RV Park Capital Expenditures: 3 Budgeting Mistakes That Wreck New Owners in Year One

    RV park capital expenditures are the expense category most new owners forget to budget for until it starts quietly wrecking their cash flow. You did the math before you closed. You looked at the T12, built your pro forma, stress-tested your occupancy, and felt confident in the numbers.

    Then you got into year one and something started eating your cash flow. Not dramatically. Not all at once. Just a slow, steady bleed that your pro forma never accounted for.

    For a lot of new RV park owners, that bleed comes from the same place: deferred maintenance and capital expenditure they did not budget for because the seller never flagged it and the broker package never mentioned it.

    This is not a due diligence failure. It is a budgeting failure. And it happens to smart, prepared buyers all the time.

    Here is what tends to get missed.

    The stuff that was already aging when you bought it

    Every RV park comes with infrastructure that has a lifespan. Utility pedestals. Septic systems. Water lines. Roofs on any structures. Gravel roads. The electrical panel in the laundry building nobody has touched in fifteen years.

    None of that shows up as a line item on the T12 because the previous owner was not replacing it. They were patching it, deferring it, or ignoring it entirely. That is often why the park was for sale.

    When you close, you inherit every deferred decision they made. The clock does not reset. The pedestal that was already ten years old on closing day is still ten years old. And when it fails, it is your cash flow that covers it.

    What a realistic RV park capital expenditures reserve actually looks like

    Most buyers who do include a CapEx line in their pro forma use a number that feels reasonable. Somewhere between one and three percent of revenue. Sometimes a flat number like $10,000 or $15,000 a year.

    That is almost always not enough.

    A realistic CapEx reserve for an RV park depends on the age and condition of the infrastructure, the number of sites, and what is due for replacement in the next three to five years. If the park has aging pedestals across 80 sites and each one costs $400 to $600 to replace, that is a $32,000 to $48,000 project sitting in your future. That is not a pro forma line item. That is a capital event.

    The way to budget for this correctly is to do a capital needs assessment before you close, or immediately after, and build a realistic replacement schedule. Not a guess. An actual inventory of what exists, how old it is, and what it will cost to replace.

    The operational expenses that only appear after you own it

    Beyond capital items, there is a category of operating expenses that simply does not exist in the seller’s numbers because the seller was not running the park the way you are going to run it.

    If you are adding a manager where the previous owner self-managed, that is a new expense line. If you are upgrading your booking software, adding a website, switching to a professional payroll service, or actually budgeting for liability insurance at a realistic level, those are new expenses that your pro forma inherited from a business that did not have them.

    This is especially common in mom-and-pop acquisitions. The seller ran lean because they lived on the property, handled everything themselves, and had relationships with vendors going back twenty years. You do not have any of that. Your cost structure is different and your pro forma needs to reflect yours, not theirs.

    What this costs you if you get it wrong

    If you underbudget CapEx and operational expenses by $30,000 to $50,000 in year one, and your projected cash flow was already modest, you are not just short on cash. You are making decisions under pressure. Deferring maintenance you should be addressing. Skipping the reserve contribution because you need the cash for operations. Starting a cycle that looks exactly like the one the previous owner was already in when they sold to you.

    I recently talked to a client who made this exact mistake. He is now selling a park he very recently purchased because he does not have the budget for the needed CapEx and the income will not come close to covering it. I cover this scenario in detail in my book, including it as one of the mistakes that cost people everything, because it is not a rare story. It is one I keep hearing.

    The park is the same. The problem is the same. The only thing that changed is whose name is on the loan.

    The fix

    Before you close, ask for a capital needs assessment or hire someone to do one. Build a CapEx reserve into your pro forma that reflects actual replacement costs on a realistic timeline, not a percentage guess. And when you are reviewing the T12, ask yourself not just what the seller was spending, but what they were not spending that you will have to.

    The expense categories that wreck year one are not usually surprises. They are just the things nobody put in the spreadsheet.


    Read this next: Ignore This Number and Your RV Park Will Cost You Money Every Single Month


    If you want the full framework for buying, managing, and understanding the financials on an RV park acquisition, I wrote ๐—™๐—ฟ๐—ผ๐—บ ๐—ข๐—ณ๐—ณ๐—ฒ๐—ฟ ๐˜๐—ผ ๐—ข๐—ฝ๐—ฒ๐—ฟ๐—ฎ๐˜๐—ถ๐—ผ๐—ป: ๐—ง๐—ต๐—ฒ ๐—–๐—ผ๐—บ๐—ฝ๐—น๐—ฒ๐˜๐—ฒ ๐—ฅ๐—ฉ ๐—ฃ๐—ฎ๐—ฟ๐—ธ ๐—œ๐—ป๐˜ƒ๐—ฒ๐˜€๐˜๐—ผ๐—ฟ’๐˜€ ๐—š๐˜‚๐—ถ๐—ฑ๐—ฒ ($49) specifically for investors who want to get this right. You can get it direct here: https://wendipvifinancial.gumroad.com/l/kqmyb, or Amazon has it too, just search author Wendi Rook.


  • How to Calculate Break-Even for Your RV Park (And Why It Changes Everything)

    How to Calculate Break-Even for Your RV Park (And Why It Changes Everything)


    Break-even is one of those terms that gets used a lot in business conversations but rarely gets defined precisely enough to be useful. Most people have a general sense of what it means. Fewer people know their actual break-even number, and almost nobody is tracking whether they have truly crossed it.

    For RV park owners, this matters more than it does in most businesses. Seasonal revenue, high fixed costs, and the gap between a strong summer and a slow winter make break-even awareness a genuine operational necessity, not just a finance concept.

    What Break-Even Actually Means

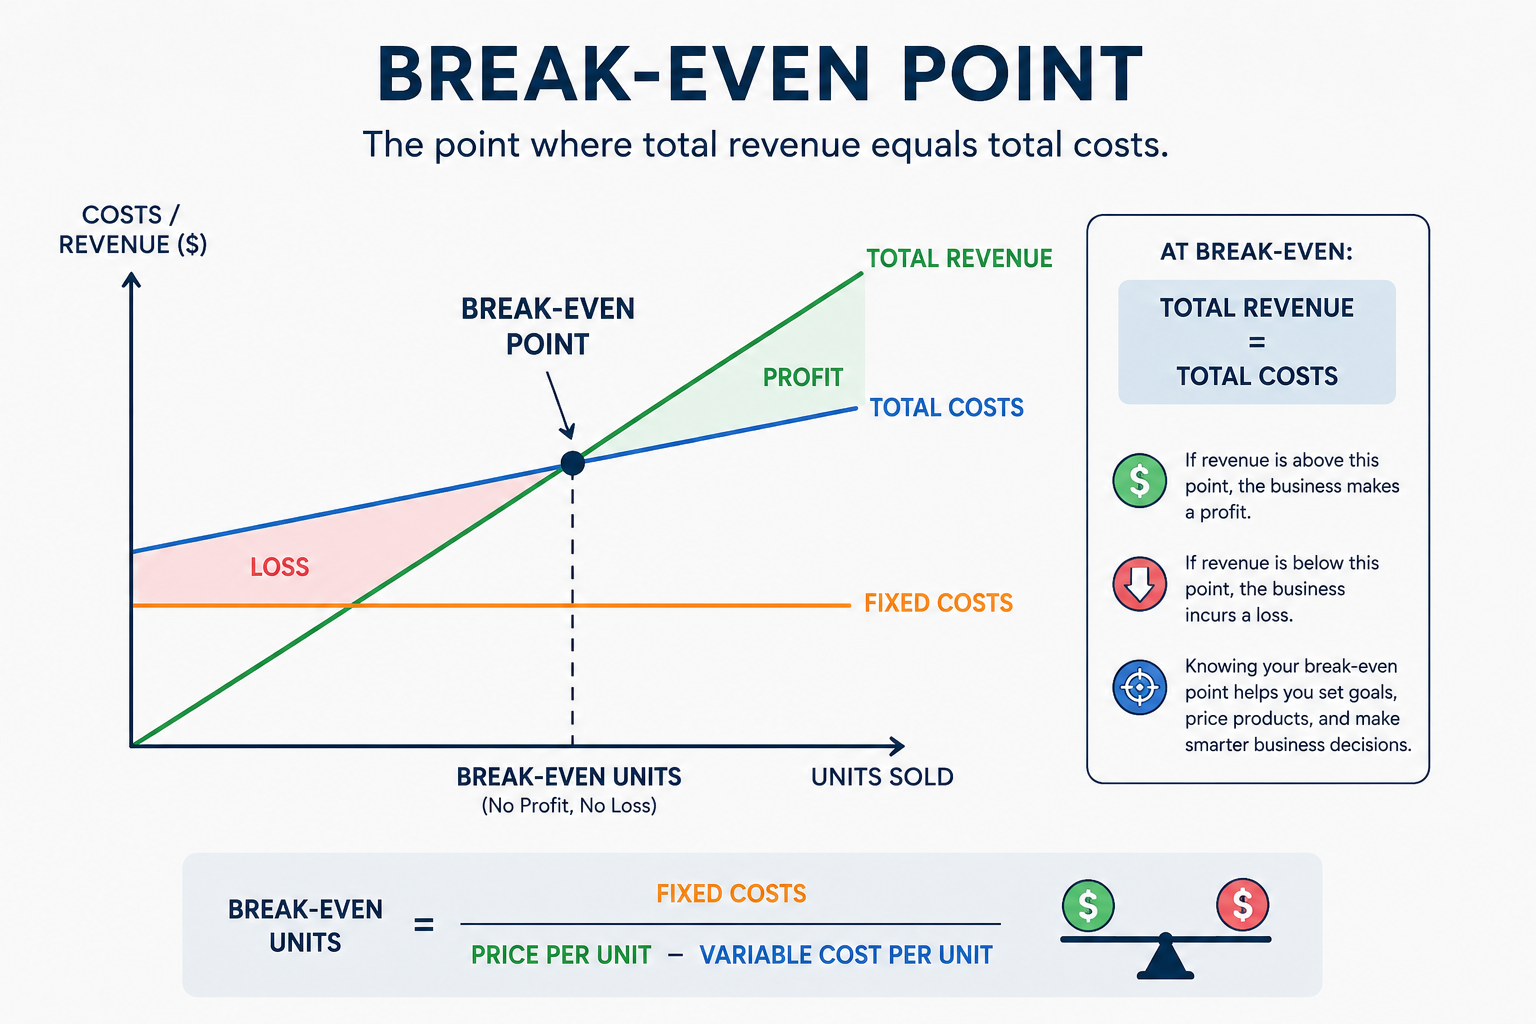
    Break-even is the point at which your total revenue equals your total expenses. Below it, you are losing money. Above it, you are generating profit. Simple in theory. Complicated in practice, because not all expenses behave the same way.

    Your fixed costs stay constant regardless of occupancy. Debt service, insurance, property taxes, management salaries, utilities with base minimums, and software subscriptions are examples. These bills arrive whether you have 10 rigs on property or 80.

    Your variable costs move with revenue. OTA commissions, credit card processing fees, cleaning supplies, and seasonal labor scale up when business is strong and down when it is slow.

    True break-even accounts for both. It is the revenue number at which your fixed costs are fully covered and your variable costs, scaled to that revenue level, are also covered. Everything above that number is profit.

    Why Seasonal Parks Have a Break-Even Problem

    A park that generates 70% of its annual revenue between Memorial Day and Labor Day is not operating at break-even in October. It is drawing down the cash reserves it built during peak season to cover fixed costs that do not stop just because the rigs do.

    This means a park can be profitable on an annual basis and still run dangerously low on cash in the off-season. The break-even question in outdoor hospitality is not just annual. It is monthly. You need to know which months you cover your costs from operations and which months you are living off of summer’s earnings.

    How to Calculate Your Break-Even

    Start with your total monthly fixed costs. Add those up and that number is your floor. Every month, no matter what, you need at least that much revenue coming in or you are going backward.

    From there, calculate your variable cost ratio. If your variable costs run at roughly 30% of revenue, then for every dollar you bring in, 70 cents is available to cover fixed costs and profit. Divide your total fixed costs by that 70 cents per dollar and you get your break-even revenue number.

    Run this calculation for each month of the year using your actual fixed cost schedule and your historical variable cost ratios. What you end up with is a monthly break-even map that tells you exactly where you are vulnerable and how much cushion your peak season needs to build.

    What to Do With the Number

    Once you know your monthly break-even, a few things become clear. You can see how much cash reserve you need to carry into the slow season to cover the months you will not break even from operations. You can set a minimum acceptable occupancy target for each month. And you can make smarter decisions about off-season rate strategy, because you know exactly what revenue you need to hit instead of guessing.

    The park owners who weather slow seasons without stress are almost always the ones who knew their break-even number going in and planned their cash position accordingly. The ones who get surprised are almost always the ones who never ran the math.

    If you want help building your break-even model, that is one of the first things I build with every new client. It is not complicated, but it is foundational, and having it changes how confidently you run your business.

    And if you have not grabbed a copy of my book yet, ๐—™๐—ฟ๐—ผ๐—บ ๐—ข๐—ณ๐—ณ๐—ฒ๐—ฟ ๐˜๐—ผ ๐—ข๐—ฝ๐—ฒ๐—ฟ๐—ฎ๐˜๐—ถ๐—ผ๐—ป: ๐—ง๐—ต๐—ฒ ๐—–๐—ผ๐—บ๐—ฝ๐—น๐—ฒ๐˜๐—ฒ ๐—ฅ๐—ฉ ๐—ฃ๐—ฎ๐—ฟ๐—ธ ๐—œ๐—ป๐˜ƒ๐—ฒ๐˜€๐˜๐—ผ๐—ฟ’๐˜€ ๐—š๐˜‚๐—ถ๐—ฑ๐—ฒ ($49), it covers the full financial and operational management framework for running your park with the discipline it deserves. You can get it direct here: wendipvifinancial.gumroad.com/l/kqmyb, or Amazon has it too, just search author Wendi Rook.

    Read this next: “Why Your RV Park’s Best Season Can Also Be Its Biggest Financial Risk”

  • The Three Numbers That Expose Every Problem in Your RV Park Before It Costs You Money

    The Three Numbers That Expose Every Problem in Your RV Park Before It Costs You Money

    Numbers run every business. But not all numbers are created equal. Some tell you what happened. Some tell you why. And a few, if you track them consistently, tell you where you are headed before you get there.

    Stick with me on this one. It gets a little technical but I promise it is worth the read. These are the numbers that tell you the real story of how your park is performing, and once you understand them you will never look at your financials the same way again.

    In an RV park there are three operating metrics that matter more than any others. They are not complicated. They do not require sophisticated software or a finance degree to calculate. But they are the metrics that separate owners who manage their asset with precision from owners who manage it by feel, and over time that difference shows up dramatically in the financial performance of the park.

    Here they are, what they mean, how to calculate them, and what they are actually telling you when you look at them together.

    Occupancy Rate

    Occupancy rate is the percentage of your available site nights that were actually occupied during a given period. It tells you how full your park was relative to its capacity.

    How to calculate it: divide occupied site nights by total available site nights and multiply by 100 to get a percentage.

    Here is a simple example. Your park has 50 sites. In the month of June there are 30 days. Your total available site nights for June are 50 sites multiplied by 30 days which equals 1,500 available site nights. If 1,050 of those site nights were actually occupied, your occupancy rate for June is 1,050 divided by 1,500 which equals 70 percent.

    What it is telling you: occupancy rate measures demand. A high occupancy rate means guests want to be at your park. A low occupancy rate means either demand is weak, your marketing is not reaching the right people, your pricing is too high, or some combination of all three.

    One important nuance. Occupancy rate alone does not tell you whether you are making money. A park running at 95 percent occupancy at $20 per night is generating less revenue than a park running at 60 percent occupancy at $65 per night. That is why you need all three metrics together, not just one.

    What to watch for: track occupancy rate month over month and year over year. A declining occupancy trend over two or three consecutive months is an early warning signal worth investigating before it shows up as a revenue problem. Rising occupancy combined with flat revenue means your pricing needs attention.

    Average Daily Rate (ADR)

    Average daily rate, or ADR, is the average revenue you earn per occupied site per night. It tells you how effectively you are pricing your inventory.

    How to calculate it: divide total site rental revenue by total occupied site nights.

    Using the same example. Your park generated $68,250 in site rental revenue in June with 1,050 occupied site nights. ADR equals $68,250 divided by 1,050 which equals $65 per night average.

    Some sites rented for $85 a night. Some rented for $45. Some had weekly discounts applied. The ADR blends all of that into one number that tells you on average what you earned per occupied site per night.

    What it is telling you: ADR measures your pricing effectiveness. It reflects the rate you are charging, the mix of site types you are selling, and any discounts or promotions you are running. A low ADR relative to comparable parks in your market suggests you have pricing upside. A declining ADR over time suggests you are discounting more than you should be or your revenue mix is shifting toward lower rate site types or longer stay guests.

    What to watch for: compare your ADR to comparable parks in your market at least once per season. If you are consistently running 15 to 20 percent below market rate and your occupancy is not significantly higher than competitors, you are leaving money on the table. Rate optimization is often the highest return initiative available to a new owner because it requires no capital investment, just pricing discipline.

    Revenue Per Available Site Night (RevPAS)

    Revenue per available site night, sometimes called RevPAS, is the single most powerful operating metric in an RV park because it combines both occupancy and rate into one number. It tells you how much revenue each site in your park generated on average, whether it was occupied or not.

    How to calculate it: divide total site rental revenue by total available site nights.

    Using the same example. Total site rental revenue of $68,250 divided by 1,500 available site nights equals $45.50 RevPAS for June.

    Notice the difference between ADR and RevPAS. ADR was $65 because it only counted occupied site nights. RevPAS is $45.50 because it counts all available site nights including the empty ones. The gap between those two numbers, $65 versus $45.50, reflects your vacancy cost. Every empty site night is a missed revenue opportunity that cannot be recovered.

    What it is telling you: RevPAS is your most honest measure of overall revenue performance because it does not let high occupancy mask low rates or high rates mask low occupancy. Two parks can have identical ADRs and very different RevPAS numbers if their occupancy rates differ. Two parks can have identical occupancy rates and very different RevPAS numbers if their pricing differs. RevPAS captures both simultaneously.

    What to watch for: track RevPAS month over month and year over year. This is the number to compare against your original pro forma projection because it reflects the combined impact of every pricing and occupancy decision you make. A RevPAS that is consistently running below your pro forma means either your rates are lower than projected, your occupancy is lower than projected, or both.

    Reading the Three Metrics Together

    The real power of these metrics comes from looking at all three simultaneously and understanding what the combination is telling you.

    Occupancy up, ADR up, RevPAS up. Everything is working. Understand what is driving it and replicate it.

    Occupancy up, ADR down, RevPAS flat. You are filling sites but discounting to do it. You have a pricing discipline problem.

    Occupancy down, ADR up, RevPAS flat. Your pricing is working but your marketing or demand is lagging. You have a volume problem.

    Occupancy up, ADR up, RevPAS flat or down. Check your math. This combination usually means you have more available sites than you are accounting for, or some sites are being taken out of inventory for maintenance and not being tracked properly.

    Occupancy down, ADR down, RevPAS down significantly. You have a fundamental performance problem that needs immediate investigation. Check your reviews, your competition, your marketing, and your pricing against the market before you do anything else.

    How Often to Track These

    Monthly at minimum. Weekly during peak season if your reservation system makes it easy to pull the data. The value of these metrics comes from the trend over time, not from a single data point. A single month of low occupancy might be weather or a local event. Three consecutive months of declining RevPAS is a pattern that requires a response.

    Build these three numbers into your monthly financial review alongside your P&L review. They contextualize everything else on the income statement and they tell you the operational story that the financial statements alone cannot tell.

    A Note on Data Quality

    These metrics are only as reliable as the data behind them. If your reservation system is not accurately tracking occupied site nights, if you are not recording discounts properly, or if some site types are being categorized inconsistently, your metrics will be misleading.

    Clean data starts with a properly configured reservation and property management system and a consistent process for recording every booking, cancellation, and discount accurately. If you are not confident your data is clean, that is the place to start before you invest time in tracking metrics that may not reflect reality.

    If you want help setting up the tracking and reporting framework to monitor these metrics consistently every month, reach out at pvifinancial.com.

    And if you have not grabbed a copy of my book yet, ๐—™๐—ฟ๐—ผ๐—บ ๐—ข๐—ณ๐—ณ๐—ฒ๐—ฟ ๐˜๐—ผ ๐—ข๐—ฝ๐—ฒ๐—ฟ๐—ฎ๐˜๐—ถ๐—ผ๐—ป: ๐—ง๐—ต๐—ฒ ๐—–๐—ผ๐—บ๐—ฝ๐—น๐—ฒ๐˜๐—ฒ ๐—ฅ๐—ฉ ๐—ฃ๐—ฎ๐—ฟ๐—ธ ๐—œ๐—ป๐˜ƒ๐—ฒ๐˜€๐˜๐—ผ๐—ฟ’๐˜€ ๐—š๐˜‚๐—ถ๐—ฑ๐—ฒ ($49), it covers the full financial and operational management framework for running your park with the discipline it deserves. You can get it direct here: wendipvifinancial.gumroad.com/l/kqmyb, or Amazon has it too, just search author Wendi Rook.


    I think you will find this very helpful as well: “How to Do Your Monthly Financial Review: A Step by Step Guide for RV Park Owners”

  • Your Shoulder Season Revenue Is Being Decided Right Now. Are You Ready?

    Your Shoulder Season Revenue Is Being Decided Right Now. Are You Ready?

    Most RV park owners think about shoulder season when it arrives. The smart ones think about it three to four months before it gets here.

    There is a shift happening in outdoor hospitality that changes the shoulder season conversation entirely. Remote work travel, longer stay behavior, and seasonal migration patterns are filling what used to be dead zones on the calendar. The guest who used to show up only in July is now showing up in April and October too, sometimes for weeks at a time, because their laptop comes with them and their boss does not care where they work from.

    Extended-stay guests now function as an economic stabilizer. They smooth cash flow and reduce reliance on weekend volatility. Parks that optimize for longer bookings are not just increasing occupancy, they are reducing revenue risk.

    But here is the catch. Those guests do not show up automatically just because you are open. They go to the parks that are ready for them, that have positioned themselves correctly, that have the amenities and the marketing in place to attract them. And most of that positioning work needs to happen before shoulder season arrives, not after you are already in it.

    Here is what to be thinking about right now if you want shoulder season to actually move your numbers this year.

    Know Your Numbers From Last Shoulder Season First

    Before you do anything else, pull your occupancy and revenue data from last year’s shoulder season. Not your peak season numbers. Your April, May, September, and October numbers specifically.

    What was your occupancy rate in those months? What was your average daily rate (ADR)? What was your revenue per available site night? How did those numbers compare to your pro forma projections for the same period?

    If you do not have that data broken out by month you have a bookkeeping setup problem to fix before next shoulder season. You cannot manage what you cannot measure and you cannot improve what you have never actually looked at specifically.

    The gap between your peak season performance and your shoulder season performance is your opportunity. Understanding how big that gap is and what is driving it tells you where to focus your energy between now and when shoulder season arrives.

    Who Is Your Shoulder Season Guest?

    Peak season guests are relatively easy to understand. Families on summer vacation, road trippers, RV club rallies. The demand is predictable and the guests largely find you.

    Shoulder season guests are different and understanding who they are changes how you market to them and what you offer them.

    The remote worker is the fastest growing shoulder season guest segment right now. They are not constrained by school calendars or peak season pricing. They can come in April when your park is quiet and stay for two or three weeks because the scenery is good and the Wi-Fi works. They typically have higher household income than the average leisure traveler, they stay longer, and they spend more on-site.

    The seasonal migrant is another significant segment. Snowbirds moving between northern summers and southern winters, retirees following the weather, full-time RV travelers who plan their routes around avoiding peak crowds and peak prices. These guests want longer term availability and they book further in advance than transient guests.

    The shoulder season event attendee is a third segment worth cultivating. Fall festivals, harvest events, local sporting events, hunting season, and fishing season all drive demand in specific markets during shoulder months. Knowing what events happen in your area in April, May, September, and October and positioning your park as the right place to stay for those events is a specific and often underutilized marketing strategy.

    What Your Park Needs to Be Ready

    The remote worker segment in particular has specific needs that not every park is set up to meet. Reliable, fast Wi-Fi is not optional for this guest. Not adequate Wi-Fi. Fast, reliable Wi-Fi that can support video calls, file uploads, and multiple devices simultaneously. If your Wi-Fi infrastructure is consumer-grade equipment that barely covers the office, you are not competitive for this segment regardless of how beautiful your location is.

    A workspace or quiet area where guests can work without being surrounded by children on summer vacation is a differentiator that costs relatively little to create and matters significantly to this guest. A picnic table near a power outlet in a quiet corner of the park is not glamorous but it serves the need.

    For longer stay guests generally, the quality of your laundry facilities matters more than it does for transient guests. So does the reliability of your electrical hookups, the quality of your water pressure, and the availability of package or mail delivery. These guests are living at your park, not just sleeping there. Design the experience accordingly.

    The Marketing Work That Needs to Happen Now

    Shoulder season guests book differently than peak season guests. They are not booking two weeks in advance for a long weekend. They are often planning further out, researching more carefully, and looking for specific features rather than just availability.

    This means your listings on Campendium, The Dyrt, Good Sam, and your own website need to specifically call out what makes your park a good shoulder season destination. Do you have reliable Wi-Fi? Say so explicitly and tell people the speed. Are you near fall foliage? Mention it with the specific months. Do you stay open through October or November when other parks in your area close? That is a competitive advantage worth advertising loudly.

    Your Google Business listing should have current photos that show the park in shoulder season conditions, not just summer shots. A photo of your park in fall foliage with a guest working on a laptop at a picnic table tells a story that a July Fourth crowd photo does not.

    Email your past guest list now if you have one. A simple message that says we are open through October, here is what we have going on this fall, and here is a link to book directly is one of the highest return marketing activities available to you. Past guests who had a good experience are your most likely shoulder season bookings and reaching them costs you almost nothing.

    The Financial Payoff

    National occupancy in 2026 is projected around 65 to 67 percent annually, but the distribution is what tells the real story. The key shift is shoulder season strengthening. Parks that capture that shift outperform the market. Parks that do not capture it are leaving occupancy and revenue on the table during months when their fixed costs are running whether guests show up or not. RV Park University

    Every occupied site night in April or October that would otherwise have been empty is almost pure margin. Your fixed costs, your insurance, your property taxes, your debt service, your base staffing, those are running regardless. The revenue from a shoulder season booking flows to your bottom line at a much higher margin than a peak season booking because you are not adding cost to generate it.

    That is the financial case for taking shoulder season seriously. Not as a nice supplement to peak season revenue, but as a deliberate strategic priority with specific marketing, amenity, and operational decisions behind it.

    The parks that figure this out before shoulder season arrives will outperform the ones that figure it out after.

    If you want help modeling what a stronger shoulder season could do to your annual NOI and asset value, reach out at pvifinancial.com.

    And if you have not grabbed a copy of my book yet, ๐—™๐—ฟ๐—ผ๐—บ ๐—ข๐—ณ๐—ณ๐—ฒ๐—ฟ ๐˜๐—ผ ๐—ข๐—ฝ๐—ฒ๐—ฟ๐—ฎ๐˜๐—ถ๐—ผ๐—ป: ๐—ง๐—ต๐—ฒ ๐—–๐—ผ๐—บ๐—ฝ๐—น๐—ฒ๐˜๐—ฒ ๐—ฅ๐—ฉ ๐—ฃ๐—ฎ๐—ฟ๐—ธ ๐—œ๐—ป๐˜ƒ๐—ฒ๐˜€๐˜๐—ผ๐—ฟ’๐˜€ ๐—š๐˜‚๐—ถ๐—ฑ๐—ฒ ($49), it covers operations, revenue management, and everything you need to run your park with financial discipline year round. You can get it direct here: wendipvifinancial.gumroad.com/l/kqmyb, or Amazon has it too, just search author Wendi Rook.


    Read this next “Don’t Overlook The Vendor Relationships That Can Make or Break Your First Year of RV Park Ownership”

  • Why Your RV Park’s Best Season Can Also Be Its Biggest Financial Risk

    Why Your RV Park’s Best Season Can Also Be Its Biggest Financial Risk

    And what to do about it before the shoulder season hits

    Ask any RV park owner what their favorite time of year is and they’ll tell you summer. The sites are full, the revenue is flowing, the energy is high and everything feels great.

    And then September arrives.

    For a lot of RV park owners the shoulder season is when the financial chickens come home to roost. The cash that felt abundant in July suddenly has to stretch a lot further. Expenses don’t drop as fast as revenue does. Payroll still runs. Debt service still runs. Insurance still runs. And if you didn’t manage your peak season cash wisely you can find yourself in a surprisingly tight spot on a property that just had its best revenue months of the year.

    I call this the peak season trap. And it catches more new owners than almost anything else.

    Here’s how to avoid it.

    Understand your revenue curve before you close

    Every RV park has a seasonality profile. Some are heavily summer weighted with 60-70% of annual revenue coming in May through August. Others have a more even distribution with strong spring and fall shoulder seasons. Some have winter demand driven by snowbirds or proximity to ski areas.

    Before you close on any RV park acquisition you should understand exactly what the monthly revenue distribution looks like over a full year. Don’t just look at the annual T12 number, break it down month by month.

    Ask for monthly revenue data going back at least two years. Map it out. Understand when the peaks are, when the valleys are, and how deep those valleys go. That monthly revenue curve is your cash flow roadmap for the first year of ownership.

    Build your budget around the valleys, not the peaks

    This is the mindset shift that separates financially savvy operators from ones who get caught short.

    When you’re in peak season it’s tempting to make spending decisions based on current cash flow. Revenue is strong, the bank account looks healthy, and there are always improvements to make and expenses to approve.

    But your peak season cash has to carry you through the valley. Every dollar you spend in July is a dollar that isn’t available in November.

    Build your annual budget starting from your lowest revenue month. Make sure your fixed costs, debt service, payroll, insurance, utilities, can be covered in your worst month with your lowest expected revenue. Everything above that is your operating cushion and your growth fund.

    If your worst month revenue can’t cover your fixed costs you have a structural problem that needs to be addressed, whether that’s adding long term tenants for stable monthly income, reducing fixed costs, or building a larger cash reserve before you close.

    Use peak season to fund your reserves

    Peak season is not just when you make money. It’s when you build the financial cushion that protects you the rest of the year.

    Here’s the system I recommend for every RV park owner going into their first peak season:

    Every week during peak season calculate what percentage of your monthly revenue target you’ve hit. Once you’ve covered your projected monthly operating expenses, debt service, and CapEx reserve contribution, every additional dollar should be split between your tax reserve and your operating cash cushion.

    The goal is to exit peak season with enough cash in your operating account to cover at least three months of fixed expenses. That cushion is your shoulder season safety net.

    If you hit that target and still have surplus cash, that’s when you think about reinvestment, improvements, or distributions. Not before.

    Watch your expense timing carefully

    One of the most common mistakes new RV park owners make is front loading expenses into peak season without thinking about the cash flow timing.

    You want to repave the entrance road. You want to upgrade the bathhouse. You want to add a new amenity. All of those are valid investments, but if you execute them during peak season you’re consuming cash at exactly the moment you should be building it.

    In general capital improvements and major discretionary expenses are better timed for the shoulder season or off season when your operations are quieter and your team has more bandwidth. Your cash will thank you.

    Plan for the transition before it happens

    Most new owners don’t start thinking about shoulder season until they’re in it. By then it’s too late to adjust.

    The time to plan for the shoulder season is during peak season, when revenue is strong and you have the mental space to think clearly. Build your shoulder season budget in July. Know exactly what your cash position needs to look like on September 1st to get you comfortably through to the following spring.

    Then manage toward that number intentionally for the rest of peak season.

    The bottom line

    Seasonality is one of the great joys of the outdoor hospitality business. There is something genuinely wonderful about a full park on a summer weekend. But it’s also one of the great financial risks, because the math of a seasonal business is unforgiving if you’re not managing it intentionally.

    The owners who thrive long term are the ones who use their best months to protect their worst months. They budget from the valley up, they build their reserves during peak season, and they never let a strong July lull them into decisions that hurt them in November.

    You can absolutely do this. And if you want a financial partner who tracks your seasonality with you, builds your cash flow forecast, and makes sure you’re set up for every season, I’d love to work with you.

    Visit me at https://www.pvifinancial.com to get started with a free Financial Health Check.

    ~Wendi | PVI Financial | Fractional CFO & Bookkeeping Services for Small Business & Outdoor Hospitality

    If this resonates you will want to read this next: “Why Profitable Businesses Run Out of Cash”

    Click here to Download my free guide, The 5 Numbers Every RV Park Buyer Must Know Before Making an Offer

  • Why Profitable Businesses Run Out of Cash and How to Make Sure Yours Doesn’t

    Why Profitable Businesses Run Out of Cash and How to Make Sure Yours Doesn’t

    The most dangerous financial surprise in business isn’t losing money. It’s running out of cash while making it.

    If I told you a business could be profitable on paper and still run out of cash and fail, you might think I was exaggerating.

    I’m not.

    It happens more often than you think and it happens to good businesses run by smart people who are working hard and growing. In fact, growth is one of the most common triggers for a cash crisis. The faster a business grows the more cash it consumes, and if the financial infrastructure isn’t in place to manage that consumption things can unravel surprisingly fast.

    Understanding why profitable businesses run out of cash is one of the most important things you can do as a business owner. So, let’s talk about it.

    First, what’s the difference between profit and cash flow?

    This is where a lot of business owners get tripped up and it’s not your fault because the language of business finance can be genuinely confusing.

    Profit is an accounting concept. It’s the difference between your revenue and your expenses as recorded in your profit and loss statement. It’s real in the sense that it reflects actual economic activity, but it doesn’t always reflect actual cash in your bank account.

    Cash flow is exactly what it sounds like. It’s the actual movement of money in and out of your business. Cash in when customers pay you. Cash out when you pay your bills, your employees, your vendors, and your lender.

    The gap between profit and cash flow is where the danger lives.

    Here’s how a profitable business runs out of cash

    Let me give you a few real world scenarios that play out every day in small businesses.

    Scenario 1, the slow paying customer

    Your business invoices $50,000 in a month. That revenue shows up on your P&L and makes the month look profitable. But your customers take 60-90 days to pay. Meanwhile your expenses, payroll, rent, supplies, are due right now. You’re profitable on paper but cash poor in reality. This is called an accounts receivable gap and it’s one of the most common cash flow killers in service businesses.

    Scenario 2, the growth trap

    Your business is growing fast. You need to hire ahead of revenue, buy more inventory, invest in equipment, and take on more overhead to support the growth. All of that investment goes out before the revenue from that growth comes in. Your P&L looks great because revenue is climbing. Your bank account tells a very different story. This is called growing broke and it has taken down businesses that were genuinely thriving on paper.

    Scenario 3, the seasonal squeeze

    Your business has a strong season and a slow season. You make most of your money in a few months and then have to stretch that cash across the rest of the year. If you spend too aggressively during your peak season you hit the slow season with insufficient cash reserves and suddenly profitable annual numbers don’t pay this month’s bills.

    Scenario 4, the tax surprise

    Your business has a great year. Revenue is up, profit is up, everything looks amazing. And then your CPA tells you that you owe $40,000 in taxes that you didn’t plan for. If you’ve been spending based on your bank balance without setting aside a tax reserve that $40,000 can create a genuine crisis even in a healthy business.

    How to make sure this doesn’t happen to you

    The good news is that cash flow problems are almost always preventable with the right systems in place. Here’s what those systems look like.

    Know your cash flow forecast, not just your P&L

    Your profit and loss statement tells you what happened. Your cash flow forecast tells you what’s coming. Every business owner should have a rolling 90-day cash flow forecast that shows projected cash in, projected cash out, and projected ending cash balance for each week or month.

    This one tool eliminates more financial surprises than anything else I know. When you can see a cash crunch coming 60 days out you have time to act. When you find out about it the day it happens you don’t.

    Separate your accounts

    Keep your operating cash, your tax reserve, and your CapEx or growth reserve in separate accounts. When everything sits in one account your bank balance is a misleading number that includes money that’s already spoken for. Separate accounts give you clarity about what you actually have available to spend.

    Invoice fast and collect faster

    The faster you get invoices out the faster cash comes in. If slow paying customers are creating a cash flow gap look at your invoicing terms and your collections process. Even shortening your payment terms from net 30 to net 15 can meaningfully improve your cash position.

    Build a cash reserve

    Every business should have a minimum of two to three months of operating expenses sitting in a dedicated reserve account that you don’t touch for day-to-day spending. This reserve is your buffer against seasonal slowdowns, unexpected expenses, slow paying customers, and any of the other scenarios I described above.

    Building this reserve takes time and discipline but it is one of the most important things you can do for the long term health of your business.

    Watch your receivables aging

    If customers owe you money that’s more than 30 days old that’s a cash flow risk. Review your accounts receivable aging report every month and follow up proactively on anything past due. Money that’s sitting in an invoice instead of your bank account is not working for your business.

    The bottom line

    Cash is oxygen for a business. You can survive a bad month on the P&L. You cannot survive running out of cash.

    The business owners who build real lasting financial health are the ones who understand the difference between profit and cash flow, who forecast their cash position consistently, and who build the systems that protect them from the surprises that take other businesses down.

    This is not complicated. But it does require intentionality and the right financial infrastructure.

    If you want help building a cash flow management system for your business, or if you want someone to forecast and track your cash position every month so you always know exactly where you stand, that’s exactly what I do.

    Visit me at https://www.pvifinancial.com and let’s make sure your business never runs out of cash.

    ~Wendi | PVI Financial | Fractional CFO & Bookkeeping Services for Small Business & Outdoor Hospitality

    Click here to read How To Structure Your First 90 Days as an RV Park Owner