Most RV park owners know they should be reviewing their financials every month. Very few of them know exactly how to do it in a way that is actually useful rather than just stressful.
This post is the step by step guide. Not a list of things to look at, but a walkthrough of how to actually do each piece of the review, what you are looking for, and what to do with what you find. Keep it open the first few times you sit down with your numbers. Eventually it becomes second nature.
Before you start, make sure your books are closed and reconciled for the month. Every bank account should match your bookkeeping software. Every transaction should be categorized. If your books are not reconciled, do that first. Reviewing unreconciled financials is like reading a map with missing roads. You will get somewhere but it will not be where you intended.
Set a recurring appointment on the same day every month. The 10th works well for most operators because it gives enough time after month end for everything to settle. Treat it as a fixed commitment, not something you get to when you have time.
Step 1: Revenue Review
Open your profit and loss statement for the month. Start at the top with total gross revenue.
Write down three numbers side by side: what you brought in this month, what you brought in during the same month last year, and what your pro forma projected for this month. You are looking for the story those three numbers tell together.
If you are ahead of last year and ahead of pro forma, something is working. Your job is to understand what specifically drove the improvement so you can replicate it. Was it a rate increase? Better occupancy? A new revenue stream? Dig one level deeper before you move on.
If you are behind last year or behind pro forma, your job is to understand why before you explain it away. Slow months happen. Weather happens. Local events cancel. But a gap between projected and actual revenue that does not have a clear explanation is a signal worth investigating, not dismissing.
Now break revenue down by stream. This is where the real information lives. Total revenue tells you what happened. Revenue by stream tells you where it came from and where it did not.
Look at each stream individually. Transient nightly revenue, long-term tenant revenue, cabin and glamping income, utility recovery, store and ancillary sales, laundry, events. For each one ask: is this performing the way I expected it to? Is it growing, flat, or declining relative to last year? If you do not have this level of detail in your books, that is a setup problem to fix before next month, not something to work around indefinitely.
Step 2: Expense Review
Move down the P&L to the expense section. Go through every line item and compare it to two things: your budget for that line and the same line from the same month last year.
You are looking for two types of variance and both matter.
The first is expenses running above budget. Pull out any line that is more than 10 to 15 percent above what you budgeted and write it down. For each one, ask why. Was it a planned expense that hit in a different month than expected? A price increase from a vendor? A repair that came up unexpectedly? Every above-budget line has a story and knowing the story tells you whether it is a one-time event or a trend that needs to be addressed.
The second type of variance is expenses running below budget, and this one catches people off guard because it looks like good news. Sometimes it is. But a maintenance line running 40 percent below budget during peak season is almost never good news. It usually means maintenance is being deferred. That deferred cost does not disappear. It is money you will eventually spend, just later and usually at a worse time. Watch the low variances just as carefully as the high ones.
Pay particular attention to your utilities line. Pull your actual utility bills and compare them to what your books show for the month. Make sure every utility cost is accounted for, including any electrical costs for long-term tenant sites that might be getting absorbed rather than passed through.
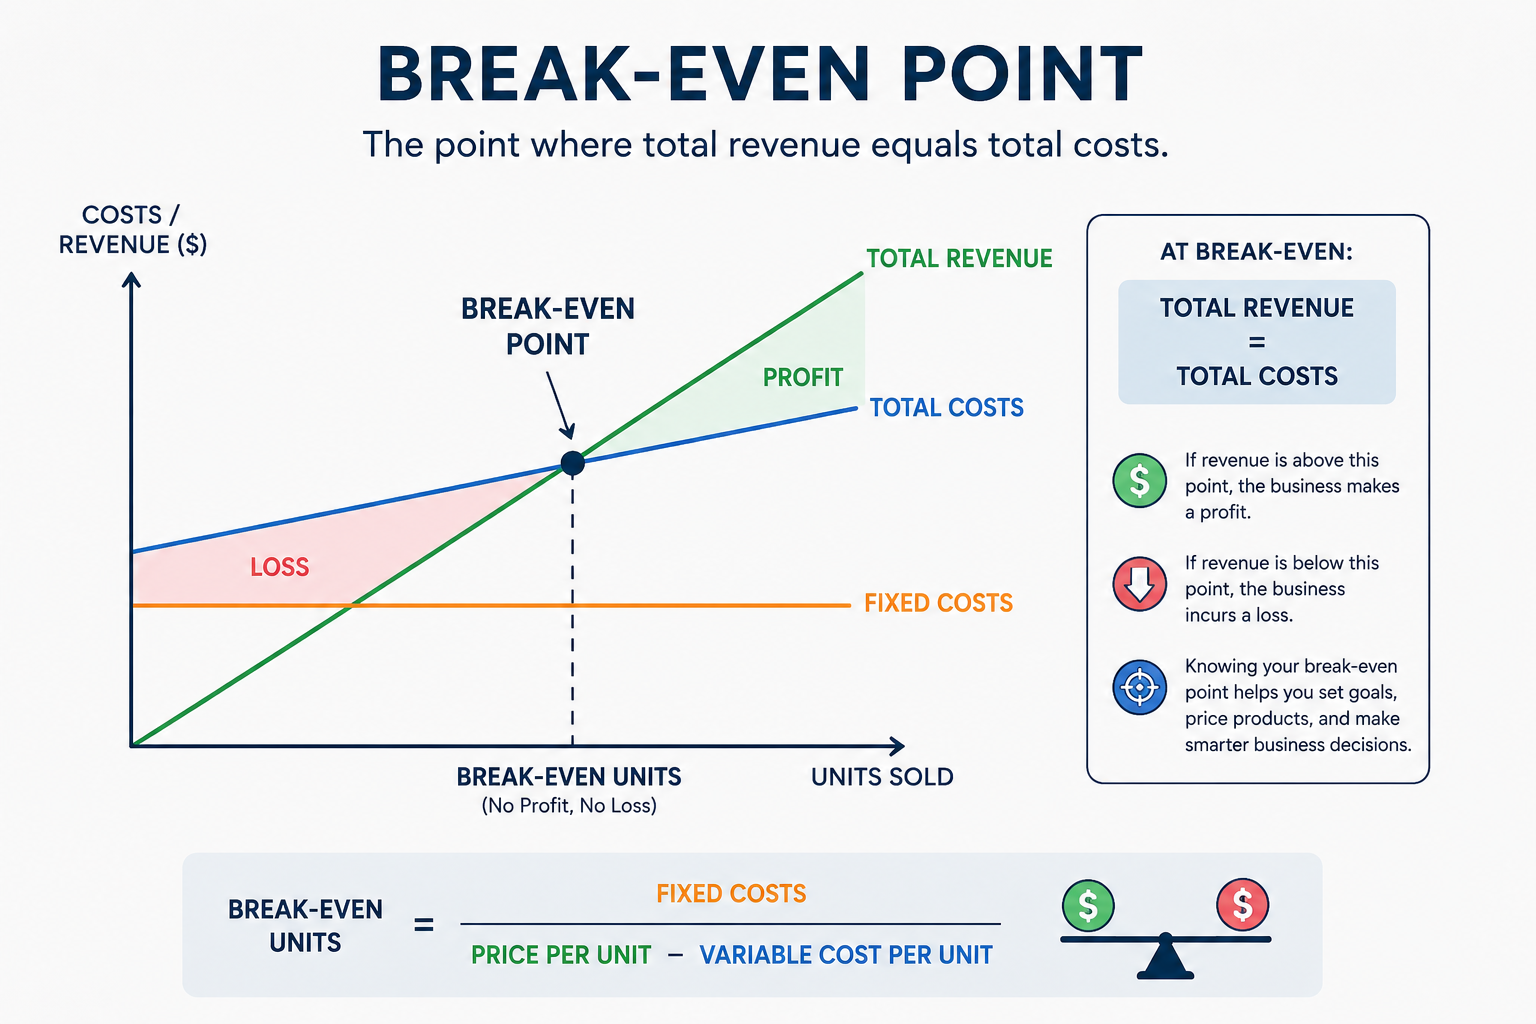
Step 3: NOI Calculation and Variance
Once you have reviewed revenue and expenses, calculate your actual NOI for the month. Gross revenue minus total operating expenses. Write that number down.
Now pull your pro forma and find the projected NOI for that same month. Compare the two.
The variance between actual and projected NOI is the most important number in your monthly review. It tells you whether the park is performing to the investment thesis you underwrote when you bought it.
If actual NOI is consistently running below projected NOI, you have a performance gap that needs to be understood and addressed. Is it coming from the revenue side, the expense side, or both? The answer to that question determines what you do about it.
If actual NOI is running above projected, understand why before you assume you are just doing well. Sometimes above-projection NOI is genuinely driven by better performance. Sometimes it is driven by deferred maintenance or costs that have not hit yet. Know which one it is.
Track your year-to-date NOI alongside the monthly number. A single month can be misleading. A cumulative picture is more reliable.
Step 4: Cash Position Review
Set aside the P&L and look at your bank accounts directly.
Check your operating account balance. Does it reflect what you expected based on the month’s revenue and expenses? If there is a meaningful gap between what the P&L shows and what is actually in the account, find out why before you move on. Timing differences happen but unexplained gaps need investigation.
Check your capital reserve account. Confirm that this month’s transfer went in. Your capital reserve should receive a minimum of 5 percent of gross revenue every single month without exception. If you skipped it because it was a slow month, transfer it now. The capital needs that reserve is protecting do not take slow months off.
Check your tax reserve account. Confirm the monthly contribution went in. If you are uncertain what percentage of net income to set aside for taxes, that is a conversation to have with your CPA, but whatever the number is, it needs to be funded monthly not scrambled for at tax time.
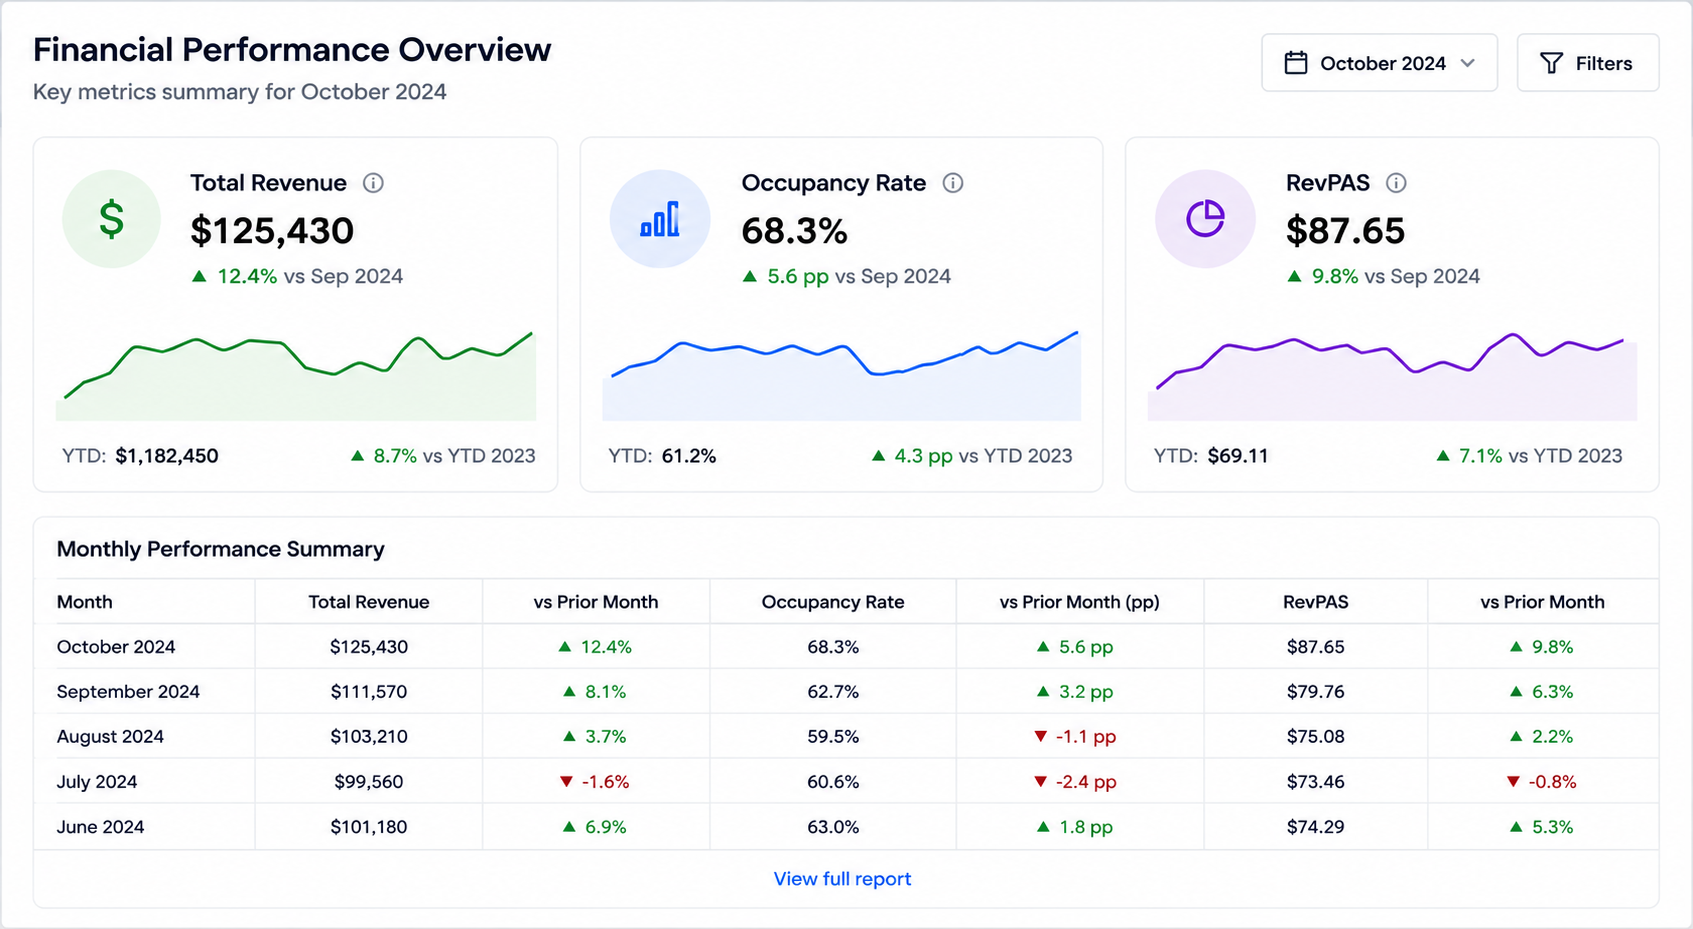
Step 5: Operating Metrics
The last piece of the review is your operating metrics. These three numbers together tell you more about the health of the business than any single line on the income statement.
Occupancy rate is the percentage of available site nights that were actually occupied during the month. Calculate it by dividing occupied site nights by total available site nights. Compare it to the same month last year and to your pro forma projection.
Average daily rate, or ADR, is your average revenue per occupied site per night. Here is a simple example so you can picture it clearly. Say your park has 40 sites and last month 30 of those sites were occupied for the full 30 days of the month. That gives you 900 occupied site nights. If your total site rental revenue for the month was $36,000, your ADR is $36,000 divided by 900, which equals $40 per night. Some sites may have rented for $55, some for $30, some had weekly discounts. The ADR averages all of that into one number that tells you what you earned on average per occupied site per night. Compare your ADR to the same month last year and to your pro forma.
Revenue per available site night combines both metrics into one number that accounts for both rate and occupancy simultaneously. Calculate it by dividing total site rental revenue by total available site nights, not just occupied ones. Using the same example, if your park has 40 sites and 30 days in the month, you have 1,200 available site nights. Divide your $36,000 revenue by 1,200 and you get $30 revenue per available site night. This number is particularly useful because it captures both how full you were and how much you charged, all in one figure.
When you look at these three metrics together you can diagnose what is driving your revenue performance quickly. Occupancy up and ADR up means strong performance on both fronts. Occupancy up but ADR down means you are filling sites but leaving rate on the table, which is a pricing opportunity. ADR up but occupancy down means your pricing may be working against your volume, which is a marketing or demand issue. Both flat or both down means something more fundamental needs attention.
Step 6: Document Your Findings and Decide What to Do
The review is not finished when you have looked at all the numbers. It is finished when you have documented what you found and made a decision about what if anything you are doing about it.
For every material variance, write down three things: what the variance was, what caused it, and what action if any you are taking. Keep this in a running monthly log that you add to every month. Over time this log becomes one of your most valuable operational documents. It shows you patterns, informs your planning, and if you ever sell the park it demonstrates to buyers that the asset was actively and intelligently managed.
If a variance has no action because it is explainable and acceptable, write that down too. The act of documenting forces you to actually think through whether you are comfortable with what you found rather than just moving on.
A Note on Setup
If you sat down to do this review and realized you do not have the data you need, that is important information. Revenue that is not broken out by stream, expenses that are lumped into generic categories, bank accounts that are not reconciled, these are setup problems that make every future review harder and less useful than it should be.
The time to fix the setup is now, not after another month of incomplete information. A chart of accounts built specifically for an RV park, connected bank feeds, and a clean monthly close process are the foundation everything else sits on.
If you want help setting up that foundation or want someone to run this review for you every month so you always have a clear picture of where you stand, reach out at pvifinancial.com.
And if you have not grabbed a copy of my book yet, 𝗙𝗿𝗼𝗺 𝗢𝗳𝗳𝗲𝗿 𝘁𝗼 𝗢𝗽𝗲𝗿𝗮𝘁𝗶𝗼𝗻: 𝗧𝗵𝗲 𝗖𝗼𝗺𝗽𝗹𝗲𝘁𝗲 𝗥𝗩 𝗣𝗮𝗿𝗸 𝗜𝗻𝘃𝗲𝘀𝘁𝗼𝗿’𝘀 𝗚𝘂𝗶𝗱𝗲 ($49), it covers the full financial management framework for running your park with the discipline it deserves.
You can get it direct here: https://wendipvifinancial.gumroad.com/l/kqmyb, or Amazon has it too, just search author Wendi Rook.
Download the free Monthly Financial Review Checklist here to use alongside this guide every month.